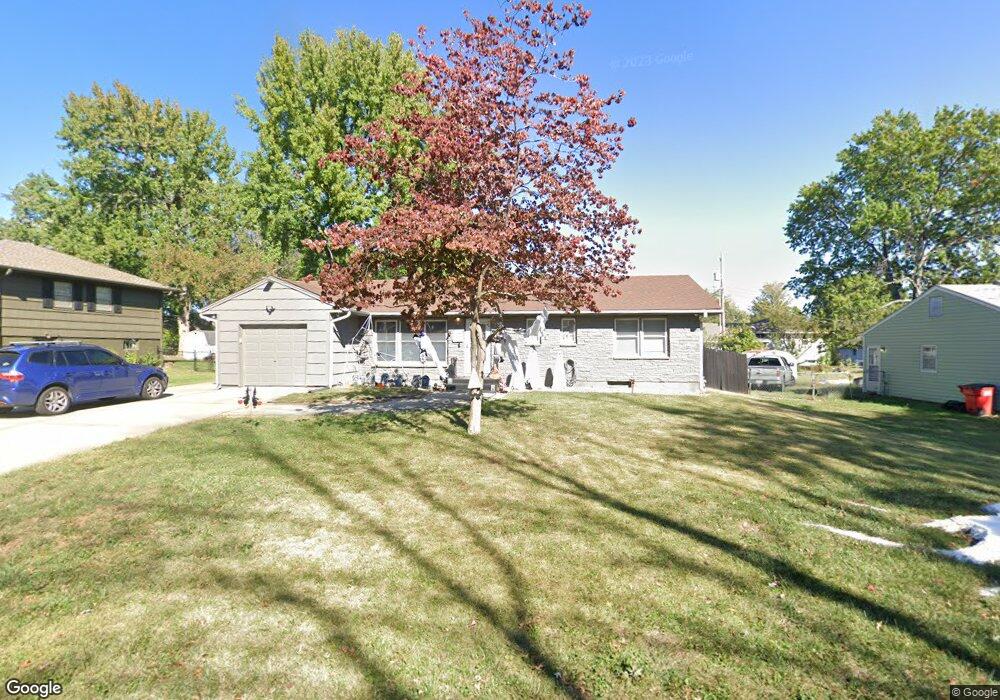
809 N Crow Ave Independence, MO 64056
Randall NeighborhoodEstimated Value: $191,000 - $221,000
3
Beds
2
Baths
1,140
Sq Ft
$180/Sq Ft
Est. Value
About This Home
This home is located at 809 N Crow Ave, Independence, MO 64056 and is currently estimated at $204,929, approximately $179 per square foot. 809 N Crow Ave is a home located in Jackson County with nearby schools including Randall Elementary School, Bridger Middle School, and Bingham Middle School.
Ownership History
Date
Name
Owned For
Owner Type
Purchase Details
Closed on
Mar 10, 2008
Sold by
Hud
Bought by
Hern Mark S
Current Estimated Value
Home Financials for this Owner
Home Financials are based on the most recent Mortgage that was taken out on this home.
Original Mortgage
$63,300
Outstanding Balance
$39,393
Interest Rate
5.72%
Mortgage Type
Purchase Money Mortgage
Estimated Equity
$165,536
Purchase Details
Closed on
Apr 16, 2007
Sold by
Federal National Mortgage Association
Bought by
Hud
Purchase Details
Closed on
Feb 26, 2007
Sold by
Rauchle Chris W and Rauchle Stacy A
Bought by
Federal National Mortgage Association
Purchase Details
Closed on
Nov 2, 2000
Sold by
Burks Glen E
Bought by
Burks Yvette R
Purchase Details
Closed on
Jun 1, 1998
Sold by
York Michel A and York Cynthia Gearke
Bought by
Rauchle Chris W and Rauchle Stacy A
Home Financials for this Owner
Home Financials are based on the most recent Mortgage that was taken out on this home.
Original Mortgage
$86,401
Interest Rate
7.2%
Mortgage Type
FHA
Create a Home Valuation Report for This Property
The Home Valuation Report is an in-depth analysis detailing your home's value as well as a comparison with similar homes in the area
Home Values in the Area
Average Home Value in this Area
Purchase History
| Date | Buyer | Sale Price | Title Company |
|---|---|---|---|
| Hern Mark S | -- | First American Title Co | |
| Hud | -- | None Available | |
| Federal National Mortgage Association | $89,388 | None Available | |
| Burks Yvette R | -- | Realty Title Company | |
| Rauchle Chris W | -- | -- |
Source: Public Records
Mortgage History
| Date | Status | Borrower | Loan Amount |
|---|---|---|---|
| Open | Hern Mark S | $63,300 | |
| Previous Owner | Rauchle Chris W | $86,401 |
Source: Public Records
Tax History
| Year | Tax Paid | Tax Assessment Tax Assessment Total Assessment is a certain percentage of the fair market value that is determined by local assessors to be the total taxable value of land and additions on the property. | Land | Improvement |
|---|---|---|---|---|
| 2025 | $1,880 | $29,718 | $5,816 | $23,902 |
| 2024 | $1,837 | $27,132 | $4,549 | $22,583 |
| 2023 | $1,837 | $27,132 | $4,129 | $23,003 |
| 2022 | $1,909 | $25,840 | $4,947 | $20,893 |
| 2021 | $1,908 | $25,840 | $4,947 | $20,893 |
| 2020 | $1,753 | $23,064 | $4,947 | $18,117 |
| 2019 | $1,725 | $23,064 | $4,947 | $18,117 |
| 2018 | $1,572 | $20,073 | $4,305 | $15,768 |
| 2017 | $1,572 | $20,073 | $4,305 | $15,768 |
| 2016 | $1,548 | $19,570 | $3,718 | $15,852 |
Source: Public Records
Map
Nearby Homes
- 17293 E Cheyenne Dr
- 17301 E Cheyenne Dr
- 809 N Swope Dr
- 801 N Redwood Dr
- 1102 N Farview Dr
- 803 N Yuma Ave
- 1207 N Atherton Rd
- 17301 E Kentucky Rd
- 411 N Queen Ridge Ave
- 209 N Davidson Ave
- 1113 N Swope Dr
- 1116 N Swope Dr
- 827 N Choctaw Ave
- 829 N Choctaw Ave
- 18001 E 12th St N
- 16501 E 3rd St N
- 320 N M 291 Hwy
- 18508 E 8th St N
- 201 S Shrank Ave
- 18505 E 5th St N
- 807 N Crow Ave
- 811 N Crow Ave
- 808 N Crow Ave
- 813 N Crow Ave
- 805 N Crow Ave
- 808 N Pawnee Ave
- 806 N Crow Ave
- 806 N Pawnee Ave
- 810 N Pawnee Ave
- 810 N Crow Ave
- 804 N Crow Ave
- 812 N Crow Ave
- 804 N Pawnee Ave
- 815 N Crow Ave
- 803 N Crow Ave
- 802 N Crow Ave
- 812 N Pawnee Ave
- 802 N Pawnee Ave
- 814 N Crow Ave
- 811 N Pawnee Ave
Your Personal Tour Guide
Ask me questions while you tour the home.