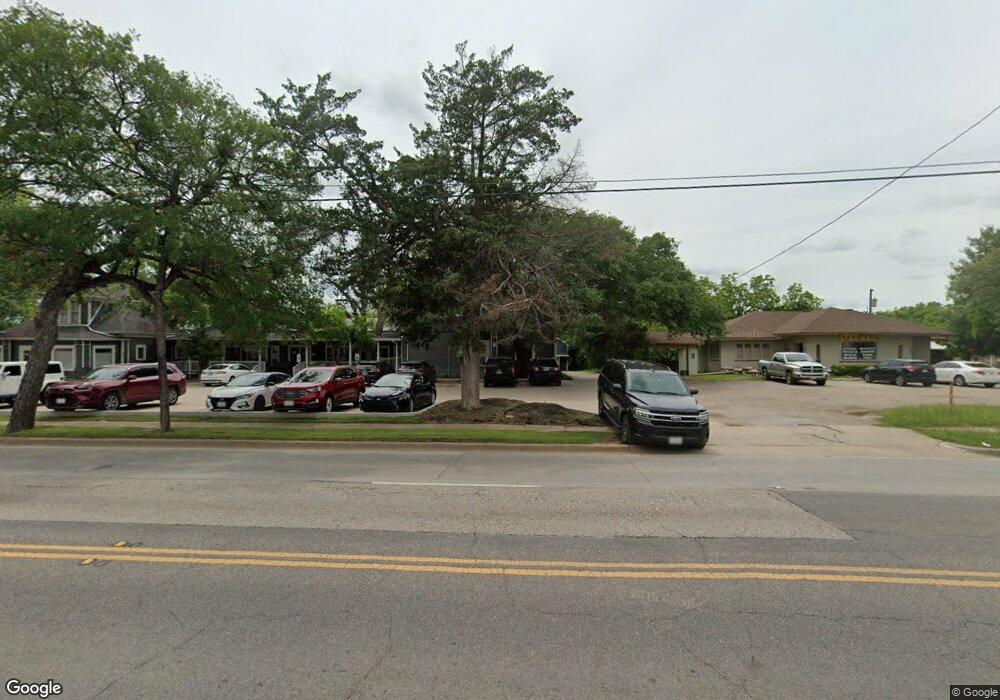
809 N Main St Cleburne, TX 76033
Estimated Value: $368,461
4
Beds
2
Baths
2,504
Sq Ft
$147/Sq Ft
Est. Value
About This Home
This home is located at 809 N Main St, Cleburne, TX 76033 and is currently priced at $368,461, approximately $147 per square foot. 809 N Main St is a home located in Johnson County with nearby schools including Cooke Elementary School, A.D. Wheat Middle School, and Cleburne High School.
Ownership History
Date
Name
Owned For
Owner Type
Purchase Details
Closed on
May 29, 2024
Sold by
Jphr Properties Llc
Bought by
Jctx Properties Llc
Current Estimated Value
Home Financials for this Owner
Home Financials are based on the most recent Mortgage that was taken out on this home.
Original Mortgage
$2,167,500
Outstanding Balance
$2,126,317
Interest Rate
7.1%
Mortgage Type
New Conventional
Purchase Details
Closed on
Dec 18, 2018
Sold by
Mcintosh Carrell and Mcintosh Kathy
Bought by
Villagomez Ruben
Purchase Details
Closed on
Oct 7, 2005
Sold by
Bone Arthur and Bone Glenda
Bought by
Mcintosh Carrell and Mcintosh Kathy
Purchase Details
Closed on
Jul 29, 2005
Sold by
Bone Arthur and Bone Glenda
Bought by
Mcintosh Carrell and Mcintosh Kathy
Create a Home Valuation Report for This Property
The Home Valuation Report is an in-depth analysis detailing your home's value as well as a comparison with similar homes in the area
Home Values in the Area
Average Home Value in this Area
Purchase History
| Date | Buyer | Sale Price | Title Company |
|---|---|---|---|
| Jctx Properties Llc | -- | None Listed On Document | |
| Villagomez Ruben | -- | Providence Title Co | |
| Mcintosh Carrell | -- | Stnt | |
| Mcintosh Carrell | -- | Stnt |
Source: Public Records
Mortgage History
| Date | Status | Borrower | Loan Amount |
|---|---|---|---|
| Open | Jctx Properties Llc | $2,167,500 |
Source: Public Records
Tax History Compared to Growth
Tax History
| Year | Tax Paid | Tax Assessment Tax Assessment Total Assessment is a certain percentage of the fair market value that is determined by local assessors to be the total taxable value of land and additions on the property. | Land | Improvement |
|---|---|---|---|---|
| 2025 | $22,117 | $1,255,756 | $249,882 | $1,005,874 |
| 2024 | $22,117 | $991,915 | $249,882 | $742,033 |
| 2023 | $18,924 | $850,396 | $249,882 | $600,514 |
| 2022 | $9,473 | $378,537 | $258,267 | $120,270 |
| 2021 | $6,691 | $256,452 | $73,791 | $182,661 |
| 2020 | $5,564 | $200,789 | $51,654 | $149,135 |
| 2019 | $5,933 | $200,789 | $51,654 | $149,135 |
| 2018 | $4,291 | $145,162 | $51,654 | $93,508 |
| 2017 | $4,273 | $145,162 | $51,654 | $93,508 |
| 2016 | $4,273 | $145,162 | $51,654 | $93,508 |
| 2015 | $3,154 | $145,162 | $51,654 | $93,508 |
| 2014 | $3,154 | $145,162 | $51,654 | $93,508 |
Source: Public Records
Map
Nearby Homes
- 107 Mcarthur Ln
- 922 N Buffalo Ave
- 105 E Lone Star Ave
- 741 N Robinson St
- 735 N Robinson St
- 109 Claude Ave
- 1204 N Wood St
- 607 N Wood St
- 709 N Wilhite St Unit 711
- 312 N Wood St
- 603 N Anglin St
- 308 Poindexter Ave
- 614 N Robinson St
- 612 N Robinson St
- 709 N Buffalo Ave
- 702 N Walnut St
- 1103 N Walnut St
- 704 Graham St
- 701 Poindexter Ave
- 507 N Buffalo Ave
- 811 N Main St
- 805 N Main St
- TBD Texas 174
- 205 Graham St
- 103 Graham St
- 108 Mcarthur Ln
- 207 Graham St
- 732 N Main St
- 110 Mcarthur Ln
- 209 Graham St
- 730 N Main St
- 112 Mcarthur Ln
- 824 N Main St
- 206 Graham St
- 737 N Anglin St
- 208 Graham St
- 208 Graham St Unit A-B
- 208 Graham St Unit A-B
- 208 Graham St Unit A
- 208 Graham St Unit B