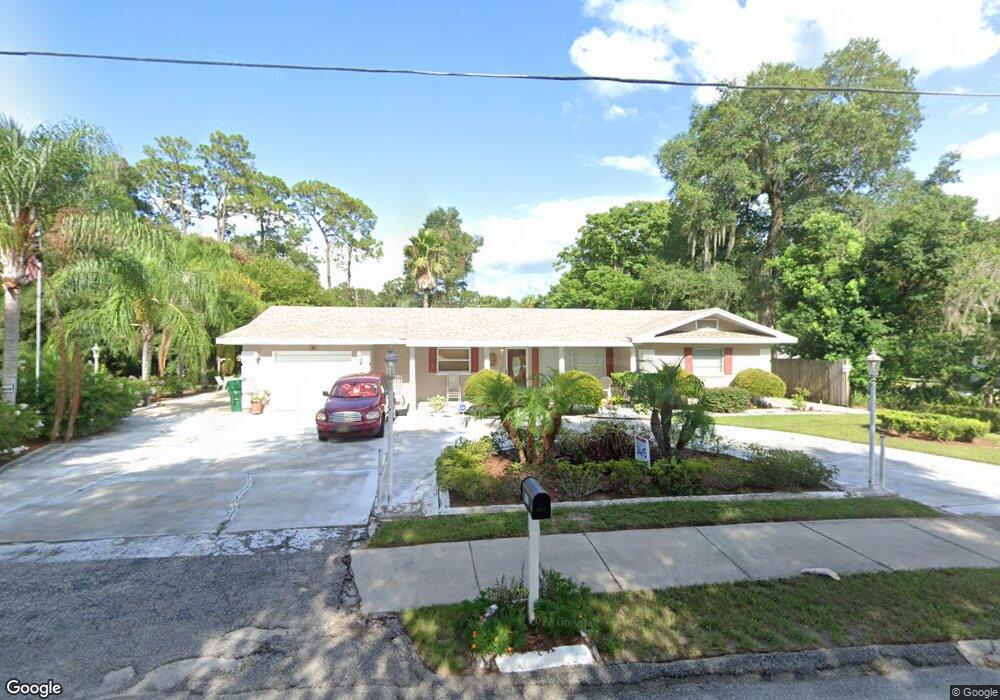
809 N Tuxedo Ave Deland, FL 32724
Estimated Value: $293,000 - $311,000
2
Beds
2
Baths
1,670
Sq Ft
$179/Sq Ft
Est. Value
About This Home
This home is located at 809 N Tuxedo Ave, Deland, FL 32724 and is currently estimated at $299,419, approximately $179 per square foot. 809 N Tuxedo Ave is a home located in Volusia County with nearby schools including George W. Marks Elementary School, Deland High School, and Deland Middle School.
Ownership History
Date
Name
Owned For
Owner Type
Purchase Details
Closed on
Aug 22, 2024
Sold by
Goosby Clarence E and Goosby Carol J
Bought by
Clarence Eugene Goosby and Clarence Carol J
Current Estimated Value
Purchase Details
Closed on
May 2, 2012
Sold by
Goosby Clarence
Bought by
Goosby Clarence E and Goosby Carol J
Purchase Details
Closed on
Sep 17, 1996
Sold by
Reedy Donna D and Hall Joan
Bought by
Nickoloff Roy
Home Financials for this Owner
Home Financials are based on the most recent Mortgage that was taken out on this home.
Original Mortgage
$91,900
Interest Rate
7.83%
Mortgage Type
VA
Purchase Details
Closed on
May 15, 1985
Bought by
Goosby Clarence E and Goosby Carol J
Purchase Details
Closed on
Oct 15, 1982
Bought by
Goosby Clarence E and Goosby Carol J
Purchase Details
Closed on
May 15, 1972
Bought by
Goosby Clarence E and Goosby Carol J
Create a Home Valuation Report for This Property
The Home Valuation Report is an in-depth analysis detailing your home's value as well as a comparison with similar homes in the area
Home Values in the Area
Average Home Value in this Area
Purchase History
| Date | Buyer | Sale Price | Title Company |
|---|---|---|---|
| Clarence Eugene Goosby | $100 | None Listed On Document | |
| Clarence Eugene Goosby | $100 | None Listed On Document | |
| Goosby Clarence E | -- | None Available | |
| Nickoloff Roy | $91,900 | -- | |
| Goosby Clarence E | $58,500 | -- | |
| Goosby Clarence E | $100 | -- | |
| Goosby Clarence E | $27,500 | -- |
Source: Public Records
Mortgage History
| Date | Status | Borrower | Loan Amount |
|---|---|---|---|
| Previous Owner | Nickoloff Roy | $91,900 |
Source: Public Records
Tax History Compared to Growth
Tax History
| Year | Tax Paid | Tax Assessment Tax Assessment Total Assessment is a certain percentage of the fair market value that is determined by local assessors to be the total taxable value of land and additions on the property. | Land | Improvement |
|---|---|---|---|---|
| 2025 | $3,339 | $239,347 | -- | -- |
| 2024 | $3,339 | $232,602 | -- | -- |
| 2023 | $3,339 | $225,828 | $0 | $0 |
| 2022 | $3,368 | $219,250 | $54,209 | $165,041 |
| 2021 | $3,647 | $177,544 | $42,797 | $134,747 |
| 2020 | $3,492 | $175,065 | $42,797 | $132,268 |
| 2019 | $3,282 | $152,015 | $31,786 | $120,229 |
| 2018 | $3,136 | $140,953 | $23,310 | $117,643 |
| 2017 | $2,939 | $126,050 | $23,401 | $102,649 |
| 2016 | $2,788 | $121,391 | $0 | $0 |
| 2015 | $2,664 | $115,626 | $0 | $0 |
| 2014 | $2,451 | $101,290 | $0 | $0 |
Source: Public Records
Map
Nearby Homes
- 701 N Tuxedo Ave
- 325 E Plymouth Ave
- 505 E Plymouth Ave
- 611 N Garfield Ave
- 830 N Clake Ave
- 930 N Amelia Ave
- 612 E Plymouth Ave
- 138 W Stetson Ave
- 503 E Minnesota Ave
- 605 John Thomas Ave
- 3 S University Cir
- 615 N Palmetto Ct
- 708 Montreville Ave
- 528 Compton Ct
- 45 S University Cir
- 740 N Sans Souci Ave
- 738 N Sans Souci Ave
- 210 W University Ave
- 406 N Kentucky Ave
- 735 N Clara Ave
- 815 N Tuxedo Ave
- 403 E Oakdale Ave
- 818 N Arlington Ave
- 820 N Arlington Ave
- 421 E Oakdale Ave
- 829 N Tuxedo Ave
- 828 N Arlington Ave
- 810 N Tuxedo Ave
- 327 E Oakdale Ave
- 425 E Oakdale Ave
- 820 N Tuxedo Ave
- 831 N Tuxedo Ave
- 824 N Tuxedo Ave
- 830 N Arlington Ave
- 325 E Oakdale Ave
- 826 N Tuxedo Ave
- 833 N Tuxedo Ave
- 830 N Tuxedo Ave
- 420 E Oakdale Ave
- 817 N Arlington Ave