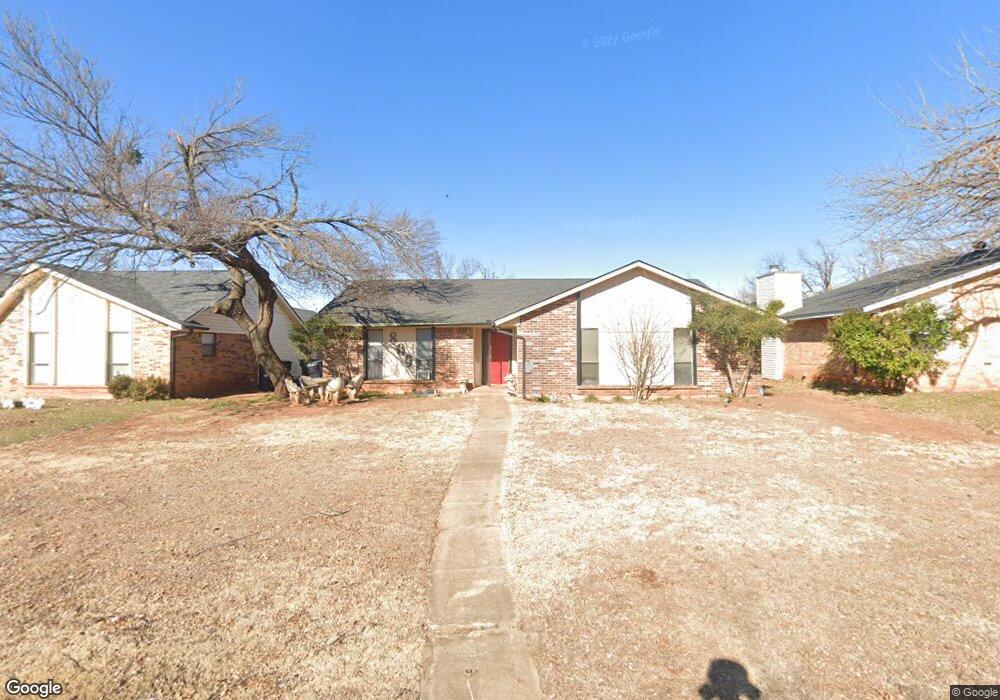
809 NW 138th St Edmond, OK 73013
Fair Hills NeighborhoodEstimated Value: $197,000 - $220,000
3
Beds
2
Baths
1,501
Sq Ft
$138/Sq Ft
Est. Value
About This Home
This home is located at 809 NW 138th St, Edmond, OK 73013 and is currently estimated at $207,331, approximately $138 per square foot. 809 NW 138th St is a home located in Oklahoma County with nearby schools including Charles Haskell Elementary School, Summit Middle School, and Santa Fe High School.
Ownership History
Date
Name
Owned For
Owner Type
Purchase Details
Closed on
Feb 3, 2021
Sold by
Fleck Clarence and Fleck Marlene
Bought by
Clarence M Fleck And Marlene L Fleck Revocabl and Fleck
Current Estimated Value
Purchase Details
Closed on
Jan 19, 2021
Sold by
Fleck Clarence and Fleck Marlene
Bought by
Fleck Clarence M and Fleck Marlene M
Purchase Details
Closed on
May 20, 2020
Sold by
Fleck Clarence
Bought by
Fleck Clarence and Fleck Marlene
Purchase Details
Closed on
Jul 30, 2004
Sold by
Bachman Daylene K and Bachman Jared
Bought by
Fleck Twyla J and Fleck Randolph E
Purchase Details
Closed on
Mar 31, 2004
Sold by
Veazey William K and Veazey Jane D
Bought by
Veazey William K
Purchase Details
Closed on
Nov 20, 2003
Sold by
Cortese Daylene and Bachman Jared
Bought by
Bachman Jared and Bachman Daylene K
Purchase Details
Closed on
Dec 16, 2002
Sold by
Veazey William K
Bought by
Veazey William K and Veazey Jane D
Create a Home Valuation Report for This Property
The Home Valuation Report is an in-depth analysis detailing your home's value as well as a comparison with similar homes in the area
Home Values in the Area
Average Home Value in this Area
Purchase History
| Date | Buyer | Sale Price | Title Company |
|---|---|---|---|
| Clarence M Fleck And Marlene L Fleck Revocabl | -- | None Listed On Document | |
| Fleck Clarence M | -- | None Available | |
| Fleck Clarence | -- | None Available | |
| Fleck Twyla J | $93,000 | Oklahoma City Abstract & Tit | |
| Veazey William K | -- | -- | |
| Bachman Jared | -- | Oklahoma City Abstract & Tit | |
| Veazey William K | -- | -- |
Source: Public Records
Tax History Compared to Growth
Tax History
| Year | Tax Paid | Tax Assessment Tax Assessment Total Assessment is a certain percentage of the fair market value that is determined by local assessors to be the total taxable value of land and additions on the property. | Land | Improvement |
|---|---|---|---|---|
| 2024 | $1,910 | $16,846 | $2,731 | $14,115 |
| 2023 | $1,910 | $16,044 | $2,761 | $13,283 |
| 2022 | $1,835 | $15,280 | $3,001 | $12,279 |
| 2021 | $1,730 | $14,553 | $2,843 | $11,710 |
| 2020 | $1,551 | $13,860 | $2,869 | $10,991 |
| 2019 | $1,514 | $13,482 | $2,768 | $10,714 |
| 2018 | $1,354 | $13,090 | $0 | $0 |
| 2017 | $1,500 | $13,368 | $2,449 | $10,919 |
| 2016 | $1,445 | $12,979 | $2,459 | $10,520 |
| 2015 | $1,424 | $12,735 | $2,459 | $10,276 |
| 2014 | $1,378 | $12,384 | $2,459 | $9,925 |
Source: Public Records
Map
Nearby Homes
- 716 NW 137th St
- 701 NW 141st St
- 704 NW 137th St
- 817 NW 141st St
- 521 NW 138th St
- 1112 NW 140th Terrace
- 816 NW 145th Cir
- 500 NW 143rd St
- 612 Glenridge Dr
- 14045 Apache Dr
- 1256 NW 138th St
- 13804 Oakmond Rd
- 14509 Oakmond Rd
- 14705 Longford Way
- 1416 Choctaw Ln
- 14809 Glenmark Dr
- 1416 NW 141st St
- 14812 Maplelake Dr
- 508 NW 150th Place
- 125 NW 147th St
- 805 NW 138th St
- 813 NW 138th St
- 801 NW 138th St
- 817 NW 138th St
- 800 NW 139th St
- 720 NW 139th St
- 804 NW 139th St
- 717 NW 138th St
- 808 NW 138th St
- 804 NW 138th St
- 821 NW 138th St
- 716 NW 139th St
- 812 NW 138th St
- 808 NW 139th St
- 800 NW 138th St
- 713 NW 138th St
- 816 NW 138th St
- 712 NW 139th St
- 812 NW 139th St
- 720 NW 138th St