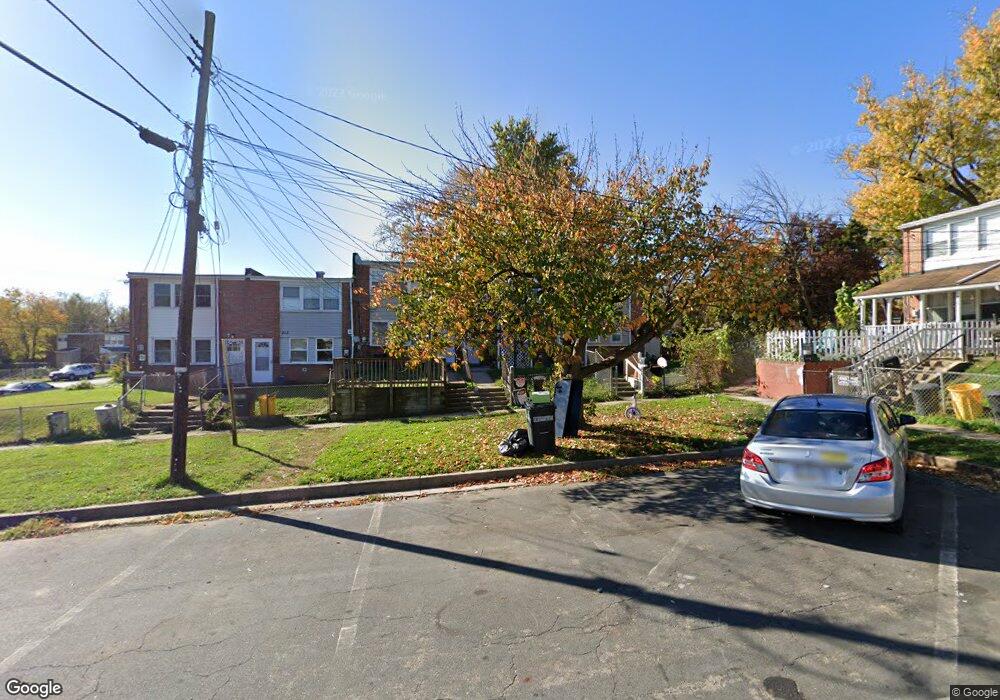
809 Regis Ct Halethorpe, MD 21227
Lansdowne NeighborhoodEstimated Value: $159,966 - $170,000
3
Beds
1
Bath
1,024
Sq Ft
$160/Sq Ft
Est. Value
About This Home
This home is located at 809 Regis Ct, Halethorpe, MD 21227 and is currently estimated at $163,992, approximately $160 per square foot. 809 Regis Ct is a home located in Baltimore County with nearby schools including Riverview Elementary School, Lansdowne Middle School, and Lansdowne High School.
Ownership History
Date
Name
Owned For
Owner Type
Purchase Details
Closed on
Mar 6, 2007
Sold by
Seymer Scott A
Bought by
Rettaliatta Frank and Seymer Kay
Current Estimated Value
Home Financials for this Owner
Home Financials are based on the most recent Mortgage that was taken out on this home.
Original Mortgage
$112,000
Outstanding Balance
$73,352
Interest Rate
8.2%
Mortgage Type
Purchase Money Mortgage
Estimated Equity
$90,640
Purchase Details
Closed on
Feb 10, 2007
Sold by
Seymer Scott A
Bought by
Rettaliatta Frank and Seymer Kay
Home Financials for this Owner
Home Financials are based on the most recent Mortgage that was taken out on this home.
Original Mortgage
$112,000
Outstanding Balance
$73,352
Interest Rate
8.2%
Mortgage Type
Purchase Money Mortgage
Estimated Equity
$90,640
Purchase Details
Closed on
Mar 9, 1996
Sold by
Miller Theodore A
Bought by
Seymer Scott A
Purchase Details
Closed on
Aug 10, 1965
Sold by
Mcgehrin John J and Mcgehrin Catherine
Bought by
Miller Theodore A
Create a Home Valuation Report for This Property
The Home Valuation Report is an in-depth analysis detailing your home's value as well as a comparison with similar homes in the area
Home Values in the Area
Average Home Value in this Area
Purchase History
| Date | Buyer | Sale Price | Title Company |
|---|---|---|---|
| Rettaliatta Frank | $130,000 | -- | |
| Rettaliatta Frank | $130,000 | -- | |
| Seymer Scott A | $58,900 | -- | |
| Miller Theodore A | $6,500 | -- |
Source: Public Records
Mortgage History
| Date | Status | Borrower | Loan Amount |
|---|---|---|---|
| Open | Rettaliatta Frank | $112,000 | |
| Closed | Rettaliatta Frank | $112,000 |
Source: Public Records
Tax History
| Year | Tax Paid | Tax Assessment Tax Assessment Total Assessment is a certain percentage of the fair market value that is determined by local assessors to be the total taxable value of land and additions on the property. | Land | Improvement |
|---|---|---|---|---|
| 2025 | $2,210 | $110,200 | -- | -- |
| 2024 | $2,210 | $100,000 | $36,000 | $64,000 |
| 2023 | $1,080 | $96,533 | $0 | $0 |
| 2022 | $1,971 | $93,067 | $0 | $0 |
| 2021 | $1,975 | $89,600 | $36,000 | $53,600 |
| 2020 | $1,975 | $89,267 | $0 | $0 |
| 2019 | $2,004 | $88,933 | $0 | $0 |
| 2018 | $2,088 | $88,600 | $36,000 | $52,600 |
| 2017 | $2,001 | $86,433 | $0 | $0 |
| 2016 | $1,782 | $84,267 | $0 | $0 |
| 2015 | $1,782 | $82,100 | $0 | $0 |
| 2014 | $1,782 | $82,100 | $0 | $0 |
Source: Public Records
Map
Nearby Homes
- 4157 Hollins Ferry Rd
- 320 Wisewell Ct
- 401 2nd Ave
- 302 4th Ave
- 413 1st Ave
- 4435 Scotia Rd
- 108 4th Ave
- 3504 Shenandoah Ave
- 4101 Oak Rd
- 216 Clyde Ave
- 4415 Norfen Rd
- 2752 Norfen Rd
- 2773 Yarnall Rd
- 2828 Alabama Ave
- 2838 Pennsylvania Ave
- 0 Monumental Ave Unit MDBC2082542
- 2905 Alabama Ave
- 2818 Rose Ave
- 3207 Janice Ave
- 2909 Louisiana Ave
Your Personal Tour Guide
Ask me questions while you tour the home.