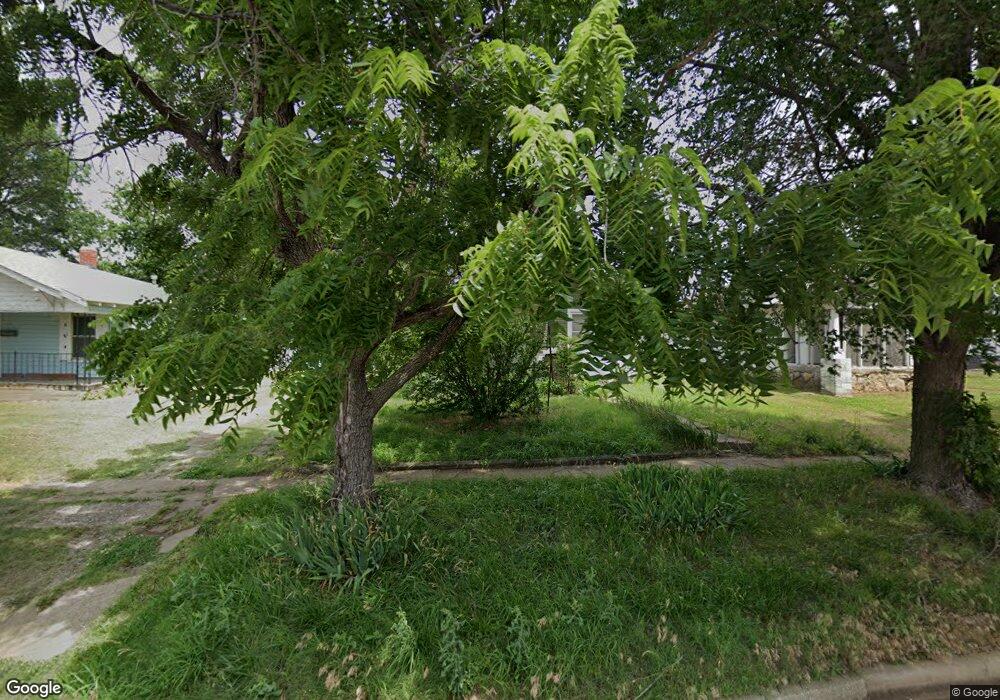
809 S 3rd St Unit 820 Ponca City, OK 74601
Estimated Value: $54,541 - $75,000
3
Beds
1
Bath
1,008
Sq Ft
$66/Sq Ft
Est. Value
About This Home
This home is located at 809 S 3rd St Unit 820, Ponca City, OK 74601 and is currently estimated at $66,385, approximately $65 per square foot. 809 S 3rd St Unit 820 is a home located in Kay County with nearby schools including Garfield Elementary School, Ponca City East Middle School, and Ponca City West Middle School.
Ownership History
Date
Name
Owned For
Owner Type
Purchase Details
Closed on
Jun 11, 2010
Sold by
Rhynard Janell Lea
Bought by
Benham David E
Current Estimated Value
Home Financials for this Owner
Home Financials are based on the most recent Mortgage that was taken out on this home.
Original Mortgage
$16,000
Outstanding Balance
$10,750
Interest Rate
5.02%
Mortgage Type
Future Advance Clause Open End Mortgage
Estimated Equity
$55,635
Purchase Details
Closed on
Aug 25, 1987
Sold by
Kelly Ernest E and Kelly Mable M
Bought by
Clara Clarence E and Clara Hawkin
Create a Home Valuation Report for This Property
The Home Valuation Report is an in-depth analysis detailing your home's value as well as a comparison with similar homes in the area
Home Values in the Area
Average Home Value in this Area
Purchase History
| Date | Buyer | Sale Price | Title Company |
|---|---|---|---|
| Benham David E | $20,000 | -- | |
| Clara Clarence E | $21,500 | -- |
Source: Public Records
Mortgage History
| Date | Status | Borrower | Loan Amount |
|---|---|---|---|
| Open | Benham David E | $16,000 |
Source: Public Records
Tax History Compared to Growth
Tax History
| Year | Tax Paid | Tax Assessment Tax Assessment Total Assessment is a certain percentage of the fair market value that is determined by local assessors to be the total taxable value of land and additions on the property. | Land | Improvement |
|---|---|---|---|---|
| 2024 | $235 | $2,487 | $311 | $2,176 |
| 2023 | $235 | $2,369 | $311 | $2,058 |
| 2022 | $215 | $2,256 | $311 | $1,945 |
| 2021 | $216 | $2,256 | $311 | $1,945 |
| 2020 | $213 | $2,249 | $311 | $1,938 |
| 2019 | $205 | $2,142 | $311 | $1,831 |
| 2018 | $205 | $2,113 | $311 | $1,802 |
| 2017 | $207 | $2,113 | $311 | $1,802 |
| 2016 | $209 | $2,113 | $311 | $1,802 |
| 2015 | $211 | $2,120 | $311 | $1,809 |
| 2014 | $205 | $2,102 | $311 | $1,791 |
Source: Public Records
Map
Nearby Homes