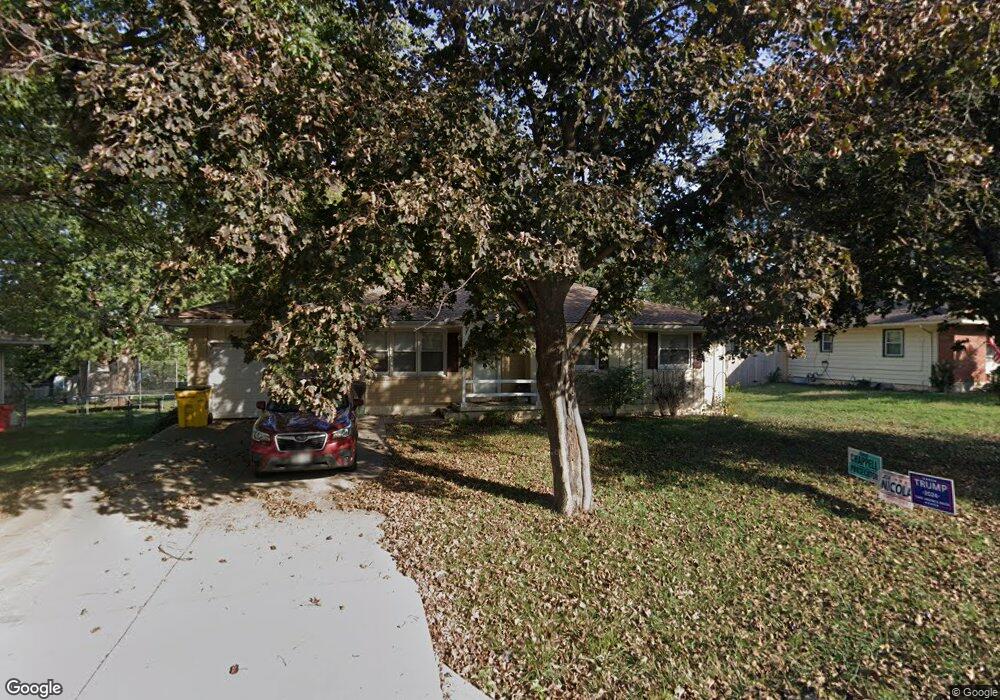
809 S Harding St Oak Grove, MO 64075
Estimated Value: $200,000 - $233,000
3
Beds
2
Baths
1,078
Sq Ft
$205/Sq Ft
Est. Value
About This Home
This home is located at 809 S Harding St, Oak Grove, MO 64075 and is currently estimated at $221,065, approximately $205 per square foot. 809 S Harding St is a home located in Jackson County with nearby schools including Oak Grove Primary School, Oak Grove Elementary School, and Oak Grove Middle School.
Ownership History
Date
Name
Owned For
Owner Type
Purchase Details
Closed on
Nov 12, 2009
Sold by
Hontz Adrienne L
Bought by
Wistrand Gerald
Current Estimated Value
Home Financials for this Owner
Home Financials are based on the most recent Mortgage that was taken out on this home.
Original Mortgage
$104,400
Outstanding Balance
$67,296
Interest Rate
4.83%
Mortgage Type
New Conventional
Estimated Equity
$153,769
Purchase Details
Closed on
Oct 26, 2004
Sold by
Craig Adrienne L and Hontz Adrienne L
Bought by
Hontz Adrienne L
Home Financials for this Owner
Home Financials are based on the most recent Mortgage that was taken out on this home.
Original Mortgage
$96,000
Interest Rate
2%
Mortgage Type
Purchase Money Mortgage
Purchase Details
Closed on
Aug 14, 2001
Sold by
Collier Marion
Bought by
Craig Adrienne L
Purchase Details
Closed on
Mar 20, 2000
Sold by
Nebgen W C W and Nebgen Rhea
Bought by
Collier Marion
Create a Home Valuation Report for This Property
The Home Valuation Report is an in-depth analysis detailing your home's value as well as a comparison with similar homes in the area
Home Values in the Area
Average Home Value in this Area
Purchase History
| Date | Buyer | Sale Price | Title Company |
|---|---|---|---|
| Wistrand Gerald | -- | Stewart Title Company | |
| Hontz Adrienne L | -- | -- | |
| Craig Adrienne L | -- | Stewart Title | |
| Collier Marion | -- | Chicago Title Co |
Source: Public Records
Mortgage History
| Date | Status | Borrower | Loan Amount |
|---|---|---|---|
| Open | Wistrand Gerald | $104,400 | |
| Previous Owner | Hontz Adrienne L | $96,000 |
Source: Public Records
Tax History
| Year | Tax Paid | Tax Assessment Tax Assessment Total Assessment is a certain percentage of the fair market value that is determined by local assessors to be the total taxable value of land and additions on the property. | Land | Improvement |
|---|---|---|---|---|
| 2025 | $1,771 | $26,220 | $5,058 | $21,162 |
| 2024 | $1,771 | $22,800 | $4,750 | $18,050 |
| 2023 | $2,178 | $28,307 | $4,589 | $23,718 |
| 2022 | $1,826 | $21,660 | $3,887 | $17,773 |
| 2021 | $1,786 | $21,660 | $3,887 | $17,773 |
| 2020 | $1,752 | $20,692 | $3,887 | $16,805 |
| 2019 | $1,666 | $20,692 | $3,887 | $16,805 |
| 2018 | $1,382 | $18,009 | $3,383 | $14,626 |
| 2017 | $1,409 | $18,009 | $3,383 | $14,626 |
| 2016 | $1,409 | $17,803 | $2,679 | $15,124 |
| 2014 | $1,255 | $15,806 | $2,832 | $12,974 |
Source: Public Records
Map
Nearby Homes
- 200 SE 8th St
- 200 SW 7th St
- 1308 S Broadway
- 502 SW Clinton St
- 902 SW Locust St
- 1705 Locust St
- 503 SW 6th St
- 804 SE 16th Terrace
- 108 N Austin St
- TBD SW 5th St
- 303 SW 17th St
- 1606 SW Stonewall Dr
- 305 SW 17th St
- 113 N Broadway
- 315 NE 4th Terrace
- 1502 SE Royal St
- TBD N Broadway St
- 612 SE 21st St
- 704 SE 21st St
- 2004 SE Oak Ridge Dr
- 811 S Harding St
- 807 S Harding St
- 810 S Park Ave
- 805 S Harding St
- 808 S Harding St
- 808 S Park Ave
- 810 S Harding St
- 812 S Park Ave
- 806 S Harding St
- 302 SE 10th St
- 806 S Park Ave
- 300 SE 10th St
- 804 S Harding St
- 803 S Harding St
- 206 SE 10th St
- 304 SE 10th St
- 804 S Park Ave
- 802 S Harding St
- 811 S Park Ave
- 204 SE 10th St
Your Personal Tour Guide
Ask me questions while you tour the home.