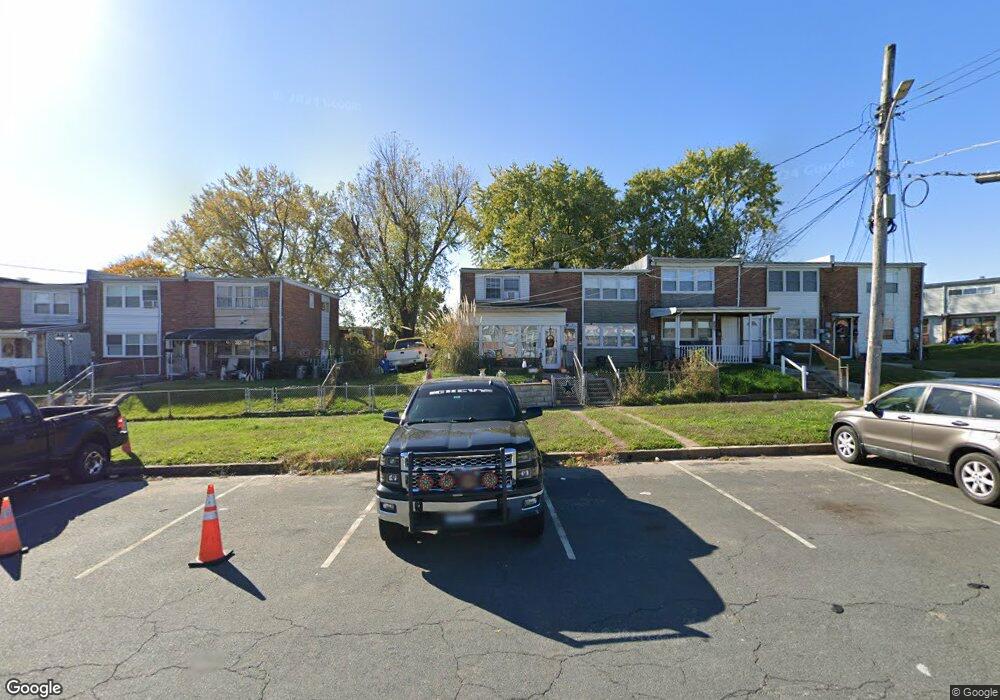
809 Seckel Ct Halethorpe, MD 21227
Lansdowne NeighborhoodEstimated Value: $147,979 - $160,000
Studio
1
Bath
1,024
Sq Ft
$150/Sq Ft
Est. Value
About This Home
This home is located at 809 Seckel Ct, Halethorpe, MD 21227 and is currently estimated at $153,326, approximately $149 per square foot. 809 Seckel Ct is a home located in Baltimore County with nearby schools including Riverview Elementary School, Lansdowne Middle School, and Lansdowne High School.
Ownership History
Date
Name
Owned For
Owner Type
Purchase Details
Closed on
Feb 27, 2019
Sold by
Nicholson Carroll Lawton
Bought by
Munion Jason M
Current Estimated Value
Home Financials for this Owner
Home Financials are based on the most recent Mortgage that was taken out on this home.
Original Mortgage
$83,460
Outstanding Balance
$73,886
Interest Rate
4.75%
Mortgage Type
FHA
Estimated Equity
$79,440
Purchase Details
Closed on
May 25, 2004
Sold by
Cooper Walter R
Bought by
Nicholson Carroll Lawton
Create a Home Valuation Report for This Property
The Home Valuation Report is an in-depth analysis detailing your home's value as well as a comparison with similar homes in the area
Home Values in the Area
Average Home Value in this Area
Purchase History
| Date | Buyer | Sale Price | Title Company |
|---|---|---|---|
| Munion Jason M | $85,000 | Terrain Title & Escrow Co | |
| Nicholson Carroll Lawton | -- | -- |
Source: Public Records
Mortgage History
| Date | Status | Borrower | Loan Amount |
|---|---|---|---|
| Open | Munion Jason M | $83,460 |
Source: Public Records
Tax History
| Year | Tax Paid | Tax Assessment Tax Assessment Total Assessment is a certain percentage of the fair market value that is determined by local assessors to be the total taxable value of land and additions on the property. | Land | Improvement |
|---|---|---|---|---|
| 2025 | $2,046 | $124,433 | -- | -- |
| 2024 | $2,046 | $113,100 | $37,400 | $75,700 |
| 2023 | $1,014 | $109,733 | $0 | $0 |
| 2022 | $1,960 | $106,367 | $0 | $0 |
| 2021 | $1,891 | $103,000 | $37,400 | $65,600 |
| 2020 | $1,622 | $98,867 | $0 | $0 |
| 2019 | $1,148 | $94,733 | $0 | $0 |
| 2018 | $1,921 | $90,600 | $37,400 | $53,200 |
| 2017 | $1,754 | $88,400 | $0 | $0 |
| 2016 | $1,790 | $86,200 | $0 | $0 |
| 2015 | $1,790 | $84,000 | $0 | $0 |
| 2014 | $1,790 | $84,000 | $0 | $0 |
Source: Public Records
Map
Nearby Homes
- 4157 Hollins Ferry Rd
- 401 2nd Ave
- 302 4th Ave
- 413 1st Ave
- 418 1st Ave
- 4438 Scotia Rd
- 4435 Scotia Rd
- 3504 Shenandoah Ave
- 216 Clyde Ave
- 4415 Norfen Rd
- 2812 Florida Ave
- 238 Elizabeth Ave
- 4323 Annapolis Rd
- 2773 Yarnall Rd
- 2828 Alabama Ave
- 0 Hammonds Ferry Rd
- 2911 Vermont Ave
- 35 Elizabeth Ave
- 0 Monumental Ave Unit MDBC2082542
- 2818 Rose Ave
Your Personal Tour Guide
Ask me questions while you tour the home.