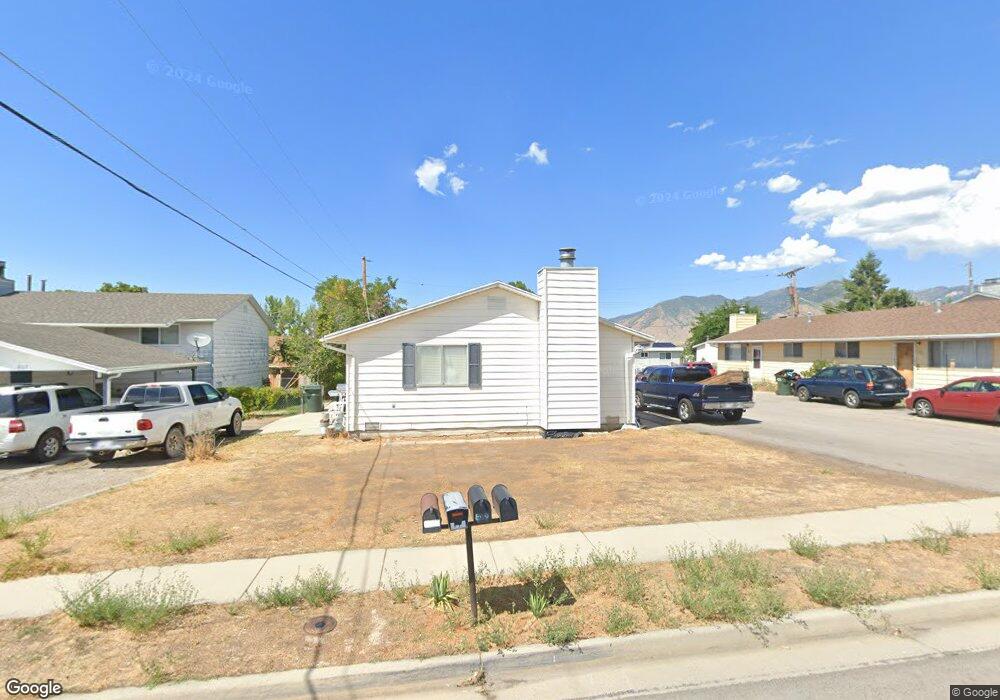
809 Uintah Ave Tooele, UT 84074
Estimated Value: $352,000 - $428,000
Studio
--
Bath
1,680
Sq Ft
$226/Sq Ft
Est. Value
About This Home
This home is located at 809 Uintah Ave, Tooele, UT 84074 and is currently estimated at $379,616, approximately $225 per square foot. 809 Uintah Ave is a home located in Tooele County with nearby schools including Sterling Elementary School, Tooele Junior High School, and Tooele High School.
Ownership History
Date
Name
Owned For
Owner Type
Purchase Details
Closed on
Mar 12, 2021
Sold by
Kessler Michael A
Bought by
K2 Investment Properties Llc
Current Estimated Value
Home Financials for this Owner
Home Financials are based on the most recent Mortgage that was taken out on this home.
Original Mortgage
$240,000
Outstanding Balance
$215,143
Interest Rate
2.7%
Mortgage Type
New Conventional
Estimated Equity
$164,473
Purchase Details
Closed on
Jan 30, 2021
Sold by
Rmb Rentals Llc
Bought by
R2 Investment Properties Llc
Home Financials for this Owner
Home Financials are based on the most recent Mortgage that was taken out on this home.
Original Mortgage
$240,000
Outstanding Balance
$215,143
Interest Rate
2.7%
Mortgage Type
New Conventional
Estimated Equity
$164,473
Purchase Details
Closed on
Nov 22, 2019
Sold by
Bowers Richard B and Bowers Melody J
Bought by
Rmb Rentals Llc
Create a Home Valuation Report for This Property
The Home Valuation Report is an in-depth analysis detailing your home's value as well as a comparison with similar homes in the area
Purchase History
| Date | Buyer | Sale Price | Title Company |
|---|---|---|---|
| K2 Investment Properties Llc | -- | Gt Title Services | |
| Kessler Michael A | -- | Gt Title Services | |
| R2 Investment Properties Llc | -- | Charger Title | |
| Rmb Rentals Llc | -- | None Available |
Source: Public Records
Mortgage History
| Date | Status | Borrower | Loan Amount |
|---|---|---|---|
| Open | Kessler Michael A | $240,000 |
Source: Public Records
Tax History
| Year | Tax Paid | Tax Assessment Tax Assessment Total Assessment is a certain percentage of the fair market value that is determined by local assessors to be the total taxable value of land and additions on the property. | Land | Improvement |
|---|---|---|---|---|
| 2025 | $2,164 | $328,176 | $97,500 | $230,676 |
| 2024 | $2,314 | $176,635 | $69,713 | $106,922 |
| 2023 | $2,314 | $182,024 | $66,399 | $115,625 |
| 2022 | $1,556 | $133,851 | $26,187 | $107,664 |
| 2021 | $1,693 | $121,815 | $20,144 | $101,671 |
| 2020 | $982 | $122,605 | $36,625 | $85,980 |
| 2019 | $998 | $122,605 | $36,625 | $85,980 |
| 2018 | $1,168 | $135,980 | $50,000 | $85,980 |
| 2017 | $984 | $135,980 | $50,000 | $85,980 |
| 2016 | $794 | $57,750 | $29,275 | $28,475 |
| 2015 | $794 | $57,750 | $0 | $0 |
| 2014 | -- | $57,750 | $0 | $0 |
Source: Public Records
Map
Nearby Homes
- 805 Uintah Ave
- 813 Uintah Ave
- 822 Bonneville Way
- 830 Bonneville Way
- 823 Uintah Ave
- 814 Bonneville Way
- 804 Uintah Ave
- 804 Uintah Ave Unit 806
- 804 Uintah Ave
- 433 Noble Rd
- 838 Bonneville Way
- 814 Uintah Ave
- 842 Bonneville Way
- 824 Uintah Ave
- 445 Noble Rd
- 842 E 470 N
- 408 Noble Rd
- 427 Noble Rd
- 1011 Bonneville Way
- 417 Noble Rd Unit 421
Your Personal Tour Guide
Ask me questions while you tour the home.