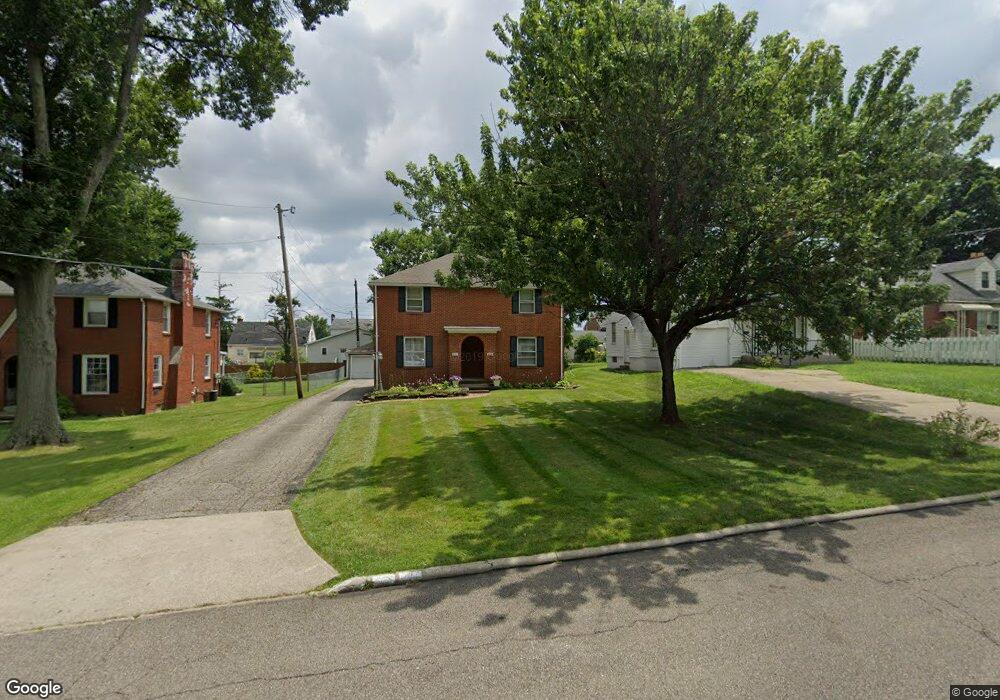
809 Yale Dr Mansfield, OH 44907
Estimated Value: $180,297 - $197,000
4
Beds
2
Baths
1,872
Sq Ft
$101/Sq Ft
Est. Value
About This Home
This home is located at 809 Yale Dr, Mansfield, OH 44907 and is currently estimated at $188,324, approximately $100 per square foot. 809 Yale Dr is a home located in Richland County with nearby schools including Discovery School, Mansfield Christian School, and Mansfield Seventh-day Adventist School.
Ownership History
Date
Name
Owned For
Owner Type
Purchase Details
Closed on
Aug 23, 2013
Sold by
Henry Claude W and Henry Sheena M
Bought by
Hand James G
Current Estimated Value
Home Financials for this Owner
Home Financials are based on the most recent Mortgage that was taken out on this home.
Original Mortgage
$107,000
Outstanding Balance
$75,816
Interest Rate
3.25%
Mortgage Type
Adjustable Rate Mortgage/ARM
Estimated Equity
$112,508
Purchase Details
Closed on
Jun 29, 2007
Sold by
Nemeth Frank and Nemeth Kimberley S
Bought by
Henry Claude W
Home Financials for this Owner
Home Financials are based on the most recent Mortgage that was taken out on this home.
Original Mortgage
$119,163
Interest Rate
6.26%
Mortgage Type
FHA
Purchase Details
Closed on
Sep 16, 1993
Sold by
Richwine Richard S
Bought by
Harsch Stephen E
Purchase Details
Closed on
Jul 1, 1991
Sold by
Haun Thomas J
Bought by
Richwine Richard S
Purchase Details
Closed on
Apr 1, 1985
Create a Home Valuation Report for This Property
The Home Valuation Report is an in-depth analysis detailing your home's value as well as a comparison with similar homes in the area
Home Values in the Area
Average Home Value in this Area
Purchase History
| Date | Buyer | Sale Price | Title Company |
|---|---|---|---|
| Hand James G | $119,000 | Chicago Title | |
| Henry Claude W | $121,025 | Attorney | |
| Harsch Stephen E | $82,500 | -- | |
| Richwine Richard S | $71,000 | -- | |
| -- | $59,500 | -- |
Source: Public Records
Mortgage History
| Date | Status | Borrower | Loan Amount |
|---|---|---|---|
| Open | Hand James G | $107,000 | |
| Previous Owner | Henry Claude W | $119,163 |
Source: Public Records
Tax History
| Year | Tax Paid | Tax Assessment Tax Assessment Total Assessment is a certain percentage of the fair market value that is determined by local assessors to be the total taxable value of land and additions on the property. | Land | Improvement |
|---|---|---|---|---|
| 2025 | $2,105 | $45,980 | $5,590 | $40,390 |
| 2024 | $2,105 | $45,980 | $5,590 | $40,390 |
| 2023 | $2,153 | $45,980 | $5,590 | $40,390 |
| 2022 | $1,936 | $34,650 | $5,000 | $29,650 |
| 2021 | $1,949 | $34,650 | $5,000 | $29,650 |
| 2020 | $1,993 | $34,650 | $5,000 | $29,650 |
| 2019 | $1,880 | $29,490 | $4,240 | $25,250 |
| 2018 | $1,855 | $29,490 | $4,240 | $25,250 |
| 2017 | $1,805 | $29,490 | $4,240 | $25,250 |
| 2016 | $1,795 | $28,450 | $4,110 | $24,340 |
| 2015 | $1,715 | $28,450 | $4,110 | $24,340 |
| 2014 | $1,693 | $28,450 | $4,110 | $24,340 |
| 2012 | $1,330 | $29,330 | $4,240 | $25,090 |
Source: Public Records
Map
Nearby Homes
- 810 Lexington Ave
- 0 George Ave
- 945 Dickson Pkwy
- 545 Stewart Ln
- 710 Lexington Ave
- 554 W Cook Rd
- 379 Edgewood Rd
- 489 Clifton Blvd
- 575 Crescent Rd
- 986 Woodland Rd
- 1091 Larchwood Rd
- 655 Woodhill Rd
- 664 Woodhill Rd
- 735 Courtwright Blvd
- 469 Crescent Rd
- 466 Lexington Ave
- 0 Lexington Ave Unit 224009661
- 530 Wood St
- 755 Locust Ln
- 178 Chilton Ave
Your Personal Tour Guide
Ask me questions while you tour the home.