8091 S 865 E Sandy, UT 84094
Sandy AreaEstimated Value: $630,000 - $728,000
About This Home
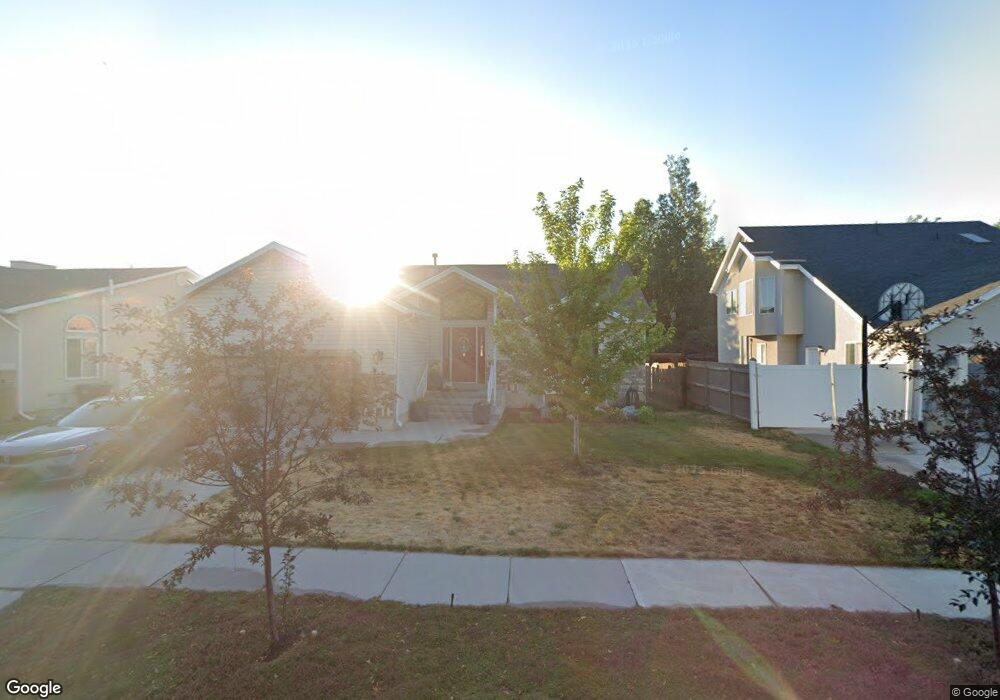
This home is located at 8091 S 865 E, Sandy, UT 84094 and is currently estimated at $678,866, approximately $232 per square foot. 8091 S 865 E is a home located in Salt Lake County with nearby schools including East Sandy School, Union Middle School, and Hillcrest High School.
Ownership History
We collect this data history from publicly available records. To have your information removed, we recommend requesting removal directly through your county’s website.
Purchase Details
Home Financials for this Owner
Home Financials are based on the most recent Mortgage that was taken out on this home.Purchase Details
Home Financials for this Owner
Home Financials are based on the most recent Mortgage that was taken out on this home.Purchase Details
Home Values in the Area
Average Home Value in this Area
Purchase History
We collect this data history from publicly available records. To have your information removed, we recommend requesting removal directly through your county’s website.
| Date | Buyer | Sale Price | Title Company |
|---|---|---|---|
| -- | Backman Title Services | ||
| -- | Accommodation | ||
| -- | None Available |
Mortgage History
We collect this data history from publicly available records. To have your information removed, we recommend requesting removal directly through your county’s website.
| Date | Status | Borrower | Loan Amount |
|---|---|---|---|
| Open | $570,000 | ||
| Previous Owner | $265,000 |
Tax History
We collect this data history from publicly available records. To have your information removed, we recommend requesting removal directly through your county’s website.
| Year | Tax Paid | Tax Assessment Tax Assessment Total Assessment is a certain percentage of the fair market value that is determined by local assessors to be the total taxable value of land and additions on the property. | Land | Improvement |
|---|---|---|---|---|
| 2025 | $3,253 | $611,000 | $162,400 | $448,600 |
| 2024 | $3,313 | $612,000 | $156,200 | $455,800 |
| 2023 | $3,270 | $602,400 | $148,400 | $454,000 |
| 2022 | $3,364 | $606,000 | $145,500 | $460,500 |
| 2021 | $2,627 | $402,100 | $113,100 | $289,000 |
| 2020 | $2,528 | $365,100 | $113,100 | $252,000 |
| 2019 | $2,416 | $339,800 | $106,700 | $233,100 |
| 2018 | $2,210 | $324,200 | $106,700 | $217,500 |
| 2017 | $2,103 | $294,400 | $106,700 | $187,700 |
| 2016 | $2,037 | $275,600 | $106,700 | $168,900 |
| 2015 | $2,081 | $261,200 | $128,400 | $132,800 |
| 2014 | $1,913 | $235,800 | $117,600 | $118,200 |
Map
- 944 E Bernay Cir
- 8022 S Peregrine Place
- 8268 S 865 E
- 899 E 7905 S
- 8087 S 615 E Unit 3
- 7795 S 1000 E
- 635 E Williamsburg Park Cir
- 723 E 8425 S
- 831 E Vics Rd
- 8097 S 535 E
- 801 E Vics Rd Unit 19
- 8277 S 560 E
- 8373 S 1100 E Unit 39
- 8101 S Cottonwood Hills Cir
- 8109 S Cottonwood Hills Cir
- 8108 S Cottonwood Hills Cir Unit 71
- 8447 Mayfly Way
- 7759 S Sandy Heights Dr
- 1176 E Cottonwood Hills Dr
- 8391 S Lorimer Ln
- 8101 S 865 E
- 8081 S 865 E
- 8074 Raptor Cove
- 8109 S 865 E
- 8071 S 865 E
- 8112 Salisbury Ct
- 8092 S 865 E
- 8068 Raptor Cove
- 8106 Salisbury Ct
- 8082 S 865 E
- 8078 Raptor Cove
- 8078 S Raptor Cove
- 8061 S 865 E
- 8115 S 865 E
- 8072 S 865 E
- 8102 S 865 E
- 8110 S 865 E
- 8118 Salisbury Ct
- 8118 S Salisbury Ct
- 8058 Raptor Cove
Ask me questions while you tour the home.