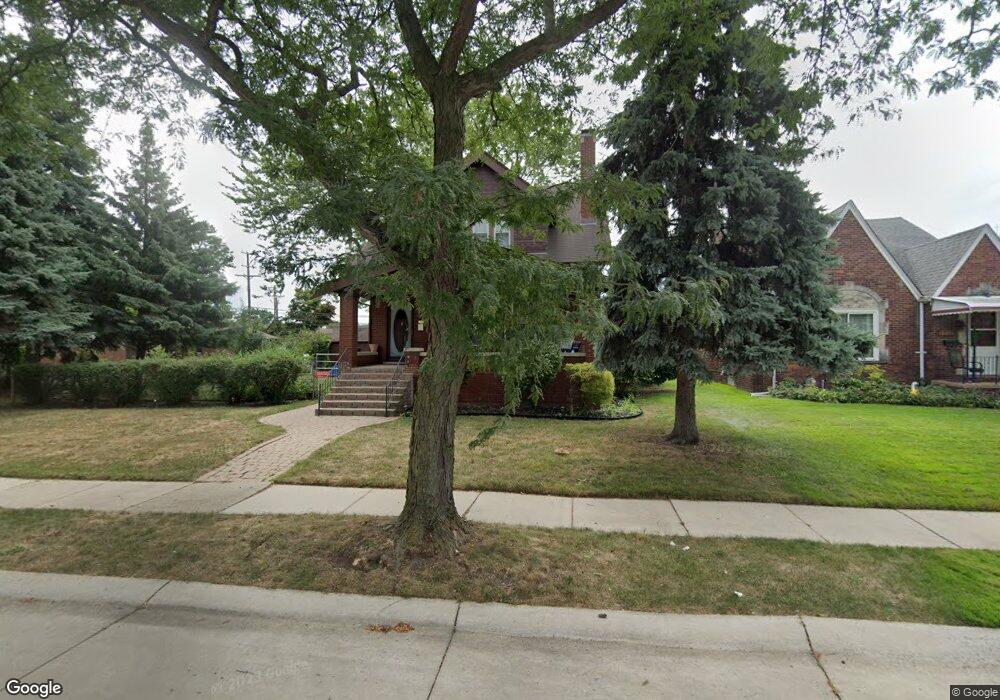
8096 Harding Center Line, MI 48015
Estimated Value: $226,257 - $254,000
4
Beds
2
Baths
1,729
Sq Ft
$139/Sq Ft
Est. Value
About This Home
This home is located at 8096 Harding, Center Line, MI 48015 and is currently estimated at $239,564, approximately $138 per square foot. 8096 Harding is a home located in Macomb County with nearby schools including May V. Peck Elementary School, Center Line High School, and Wolfe Middle School.
Ownership History
Date
Name
Owned For
Owner Type
Purchase Details
Closed on
Oct 30, 2018
Sold by
Reeser Thomas J and Reeser Carol L
Bought by
Reeser Christopher and Reeser Jaime
Current Estimated Value
Home Financials for this Owner
Home Financials are based on the most recent Mortgage that was taken out on this home.
Original Mortgage
$128,800
Outstanding Balance
$112,788
Interest Rate
4.6%
Mortgage Type
New Conventional
Estimated Equity
$126,776
Create a Home Valuation Report for This Property
The Home Valuation Report is an in-depth analysis detailing your home's value as well as a comparison with similar homes in the area
Home Values in the Area
Average Home Value in this Area
Purchase History
| Date | Buyer | Sale Price | Title Company |
|---|---|---|---|
| Reeser Christopher | $161,000 | Premier Title Agency Llc |
Source: Public Records
Mortgage History
| Date | Status | Borrower | Loan Amount |
|---|---|---|---|
| Open | Reeser Christopher | $128,800 |
Source: Public Records
Tax History
| Year | Tax Paid | Tax Assessment Tax Assessment Total Assessment is a certain percentage of the fair market value that is determined by local assessors to be the total taxable value of land and additions on the property. | Land | Improvement |
|---|---|---|---|---|
| 2025 | $2,384 | $111,700 | $0 | $0 |
| 2024 | $24 | $103,700 | $0 | $0 |
| 2023 | $2,273 | $93,200 | $0 | $0 |
| 2022 | $2,816 | $81,800 | $0 | $0 |
| 2021 | $2,931 | $75,300 | $0 | $0 |
| 2020 | $2,391 | $69,400 | $0 | $0 |
| 2019 | $3,056 | $61,400 | $0 | $0 |
| 2018 | $0 | $50,890 | $0 | $0 |
| 2017 | $2,803 | $45,780 | $7,580 | $38,200 |
| 2016 | $2,797 | $45,780 | $0 | $0 |
| 2015 | -- | $40,920 | $0 | $0 |
| 2011 | -- | $49,150 | $7,380 | $41,770 |
Source: Public Records
Map
Nearby Homes
Your Personal Tour Guide
Ask me questions while you tour the home.