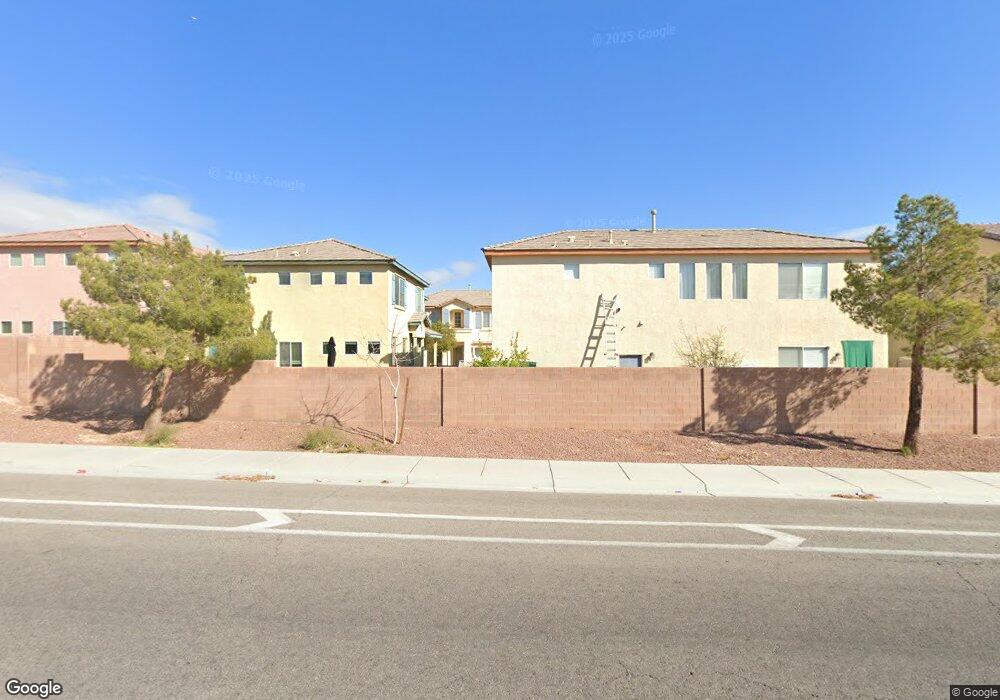
8099 Retriever Ave Unit 6 Las Vegas, NV 89147
Estimated Value: $455,691 - $515,000
2
Beds
4
Baths
2,540
Sq Ft
$194/Sq Ft
Est. Value
About This Home
This home is located at 8099 Retriever Ave Unit 6, Las Vegas, NV 89147 and is currently estimated at $492,923, approximately $194 per square foot. 8099 Retriever Ave Unit 6 is a home located in Clark County with nearby schools including Roger M Bryan Elementary School, Clifford J Lawrence Junior High School, and Spring Valley High School.
Ownership History
Date
Name
Owned For
Owner Type
Purchase Details
Closed on
Aug 16, 2019
Sold by
Zhang Lu
Bought by
The Lu Zhang Living Trust
Current Estimated Value
Purchase Details
Closed on
Nov 22, 2010
Sold by
Mininni Robert
Bought by
Zhang Lu
Purchase Details
Closed on
Oct 27, 2010
Sold by
Federal National Mortgage Association
Bought by
Mininni Robert
Purchase Details
Closed on
Jun 9, 2010
Sold by
Zhang Lihua
Bought by
Federal National Mortgage Association
Purchase Details
Closed on
Apr 23, 2004
Sold by
Stearns Aaron
Bought by
Zhang Lihua
Home Financials for this Owner
Home Financials are based on the most recent Mortgage that was taken out on this home.
Original Mortgage
$241,200
Interest Rate
4.75%
Mortgage Type
Unknown
Create a Home Valuation Report for This Property
The Home Valuation Report is an in-depth analysis detailing your home's value as well as a comparison with similar homes in the area
Home Values in the Area
Average Home Value in this Area
Purchase History
| Date | Buyer | Sale Price | Title Company |
|---|---|---|---|
| The Lu Zhang Living Trust | -- | None Available | |
| Zhang Lu | $178,000 | None Available | |
| Mininni Robert | $178,000 | Lawyers Title Of Nevada Mid | |
| Federal National Mortgage Association | $190,417 | None Available | |
| Zhang Lihua | $253,908 | Community Title | |
| Zhang Lihua | $253,908 | Community Title |
Source: Public Records
Mortgage History
| Date | Status | Borrower | Loan Amount |
|---|---|---|---|
| Previous Owner | Zhang Lihua | $241,200 |
Source: Public Records
Tax History Compared to Growth
Tax History
| Year | Tax Paid | Tax Assessment Tax Assessment Total Assessment is a certain percentage of the fair market value that is determined by local assessors to be the total taxable value of land and additions on the property. | Land | Improvement |
|---|---|---|---|---|
| 2025 | $2,371 | $133,672 | $33,600 | $100,072 |
| 2024 | $2,302 | $133,672 | $33,600 | $100,072 |
| 2023 | $2,302 | $127,719 | $33,250 | $94,469 |
| 2022 | $2,450 | $114,497 | $28,350 | $86,147 |
| 2021 | $2,269 | $106,397 | $24,500 | $81,897 |
| 2020 | $2,104 | $103,441 | $22,400 | $81,041 |
| 2019 | $1,971 | $102,089 | $22,400 | $79,689 |
| 2018 | $1,914 | $93,480 | $17,150 | $76,330 |
| 2017 | $2,702 | $92,136 | $14,700 | $77,436 |
| 2016 | $1,813 | $80,211 | $10,500 | $69,711 |
| 2015 | $1,809 | $67,825 | $10,150 | $57,675 |
| 2014 | $1,756 | $58,093 | $5,250 | $52,843 |
Source: Public Records
Map
Nearby Homes
- 8139 Retriever Ave
- 8143 Retriever Ave
- 8109 Retriever Ave
- 3722 Violet Rose Ct
- 3634 Surfboard Ct
- 3637 Pinnate Dr
- 3746 Bombastic Ct
- 8003 Retriever Ave
- 3749 Climbing Rose St
- 3508 Harbor Tides St
- 7938 Angel Tree Ct
- 8061 Petunia Flower Way
- 3440 Meridale Dr
- 3685 Springbud Dr
- 8153 Dinsmore Dr
- 8122 W Flamingo Rd Unit 226
- 8122 W Flamingo Rd Unit 148
- 7968 Dinsmore Dr
- 8064 Kentshire Dr
- 3372 Ceremony Dr
- 8095 Retriever Ave Unit 6
- 8105 Retriever Ave
- 8096 Retriever Ave
- 8102 Retriever Ave
- 8091 Retriever Ave Unit 6
- 8111 Retriever Ave
- 8087 Retriever Ave
- 8071 Retriever Ave
- 8075 Retriever Ave Unit 6
- 8106 Retriever Ave
- 8083 Retriever Ave
- 8117 Retriever Ave
- 8079 Retriever Ave Unit 6
- 8130 Retriever Ave
- 8088 Retriever Ave
- 8110 Retriever Ave Unit 6
- 8068 Retriever Ave Unit 6
- 8133 Retriever Ave
- 8061 Retriever Ave
- 8057 Retriever Ave