T
Landlord's Agent in 2025
Thomas McPherson
RE/MAX


Estimated Value: $574,000 - $642,000
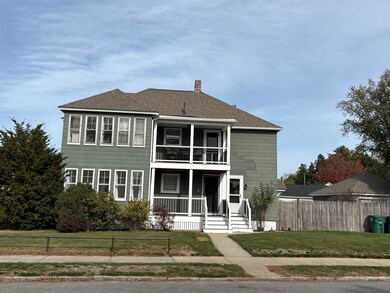
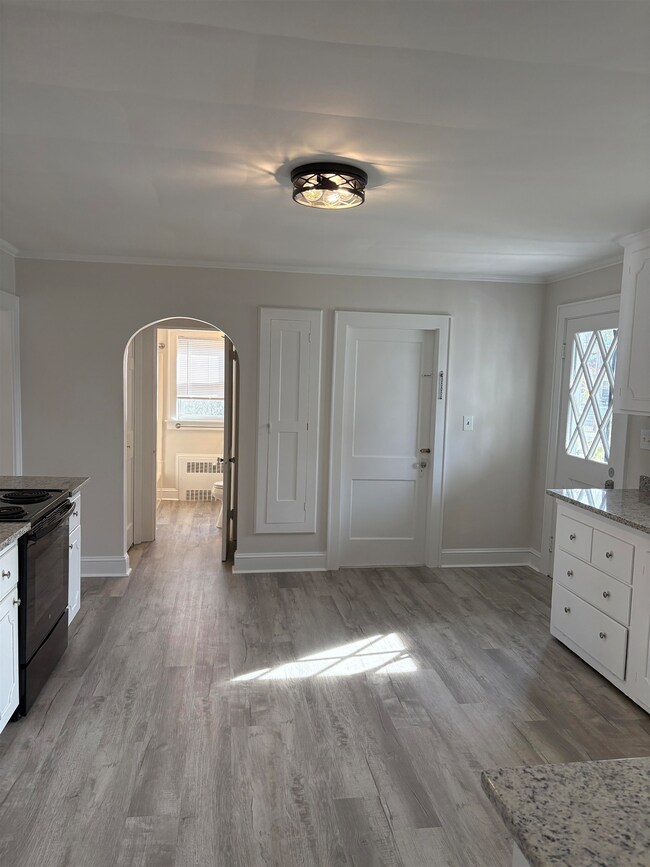
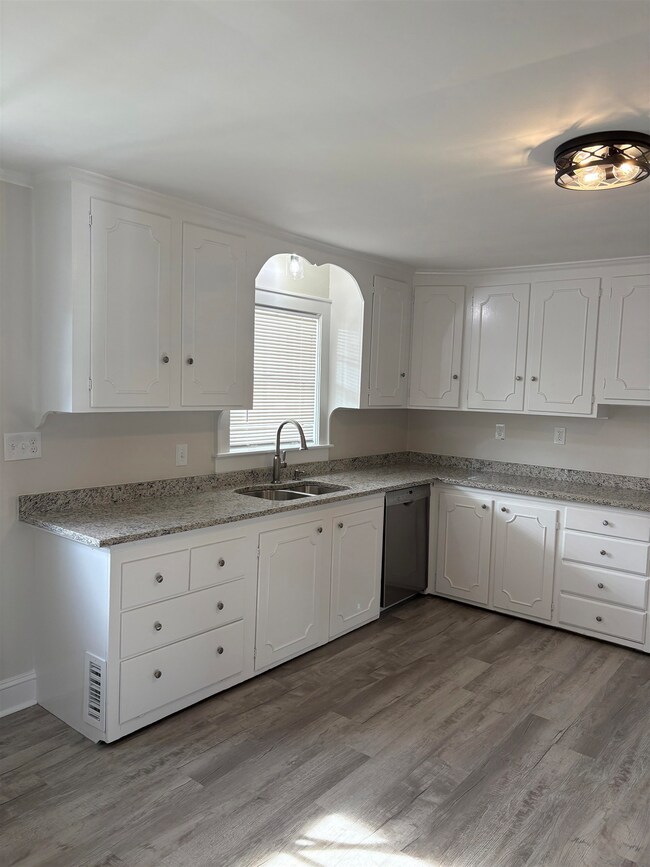
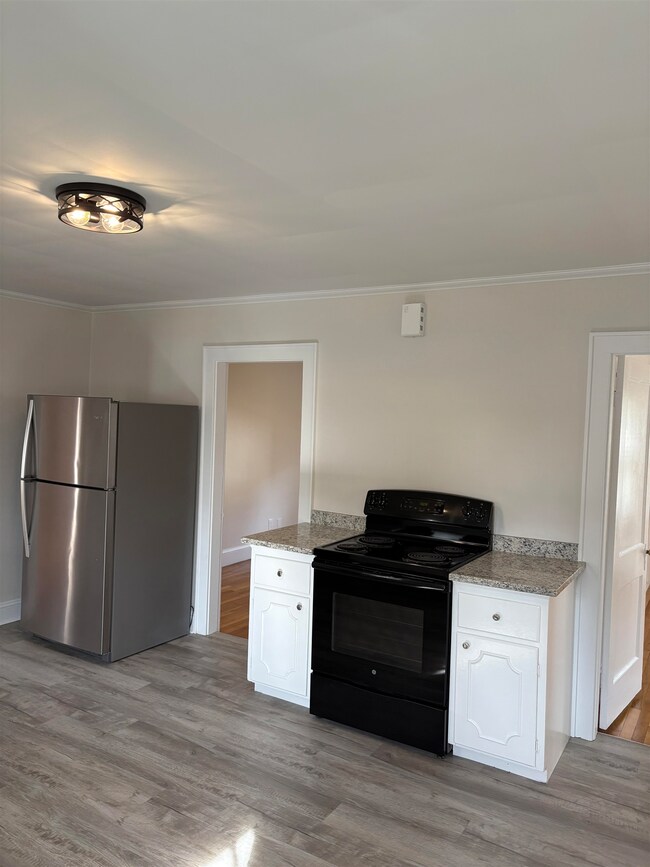
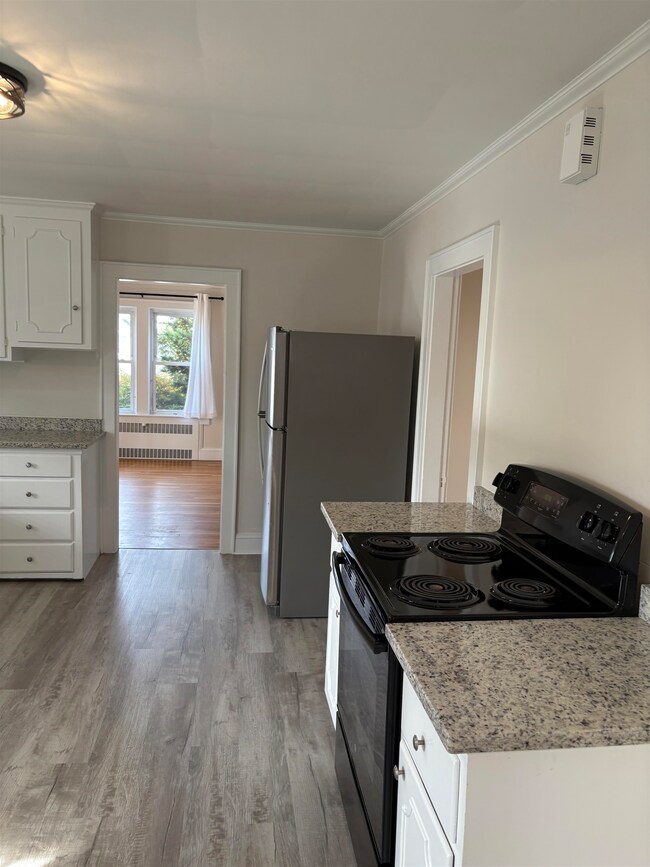
Recently renovated two-bedroom one bathroom apartment in two family in Nashua’s Crown Hill area. The apartment is 1250 sqft. Harwood floors throughout, new kitchen & bathroom floors, granite counters. FHA heating system natural gas, fully applianced including washer & dryer, 2 parking spaces in driveway fenced in backyard. NO PETS, NO SMOKERS! Very good credit required. Owner is a licensed Real Estate Broker & occupies the 2nd floor unit. Accompanied showings by appointment.
Last Agent to Rent the Property
Thomas McPherson
RE/MAX Innovative Properties Brokerage Email: tmcpherson@nhhomes.com License #034581 Listed on: 10/20/2025

Last Renter's Agent
None - no buyer representation
A Non PrimeMLS Agency
| Date | Buyer | Sale Price | Title Company |
|---|---|---|---|
| Mcpherson Thomas R | $158,000 | -- |
| Date | Status | Borrower | Loan Amount |
|---|---|---|---|
| Open | Mcpherson Thomas R | $268,000 | |
| Closed | Mcpherson Thomas R | $33,500 | |
| Closed | Mcpherson Thomas R | $157,874 |
| Date | Event | Price | List to Sale | Price per Sq Ft |
|---|---|---|---|---|
| 10/27/2025 10/27/25 | Rented | $2,350 | -6.0% | -- |
| 10/20/2025 10/20/25 | For Rent | $2,500 | -- | -- |
| Year | Tax Paid | Tax Assessment Tax Assessment Total Assessment is a certain percentage of the fair market value that is determined by local assessors to be the total taxable value of land and additions on the property. | Land | Improvement |
|---|---|---|---|---|
| 2024 | $7,979 | $501,800 | $156,100 | $345,700 |
| 2023 | $7,452 | $408,800 | $124,900 | $283,900 |
| 2022 | $7,371 | $407,900 | $124,900 | $283,000 |
| 2021 | $6,172 | $265,800 | $83,200 | $182,600 |
| 2020 | $6,010 | $265,800 | $83,200 | $182,600 |
| 2019 | $5,784 | $265,800 | $83,200 | $182,600 |
| 2018 | $5,638 | $265,800 | $83,200 | $182,600 |
| 2017 | $5,114 | $198,300 | $73,100 | $125,200 |
| 2016 | $4,971 | $198,300 | $73,100 | $125,200 |
| 2015 | $4,864 | $198,300 | $73,100 | $125,200 |
| 2014 | $4,769 | $198,300 | $73,100 | $125,200 |
T
Landlord's Agent in 2025
Thomas McPherson
RE/MAX
N
Tenant's Agent in 2025
None - no buyer representation
VT_ME_NH_NEREN
Source: PrimeMLS
MLS Number: 5066462
APN: NASH-000020-000000-000049
Disclaimer: Certain information contained herein is derived from information provided by parties other than Homes.com. All information provided is deemed reliable, but is not guaranteed to be accurate and should be independently verified.
![]() Copyright 2025 PrimeMLS, Inc. All rights reserved. This information is deemed reliable, but not guaranteed. The data relating to real estate displayed on this display comes in part from the IDX Program of PrimeMLS. The information being provided is for consumers’ personal, non-commercial use and may not be used for any purpose other than to identify prospective properties consumers may be interested in purchasing.
Copyright 2025 PrimeMLS, Inc. All rights reserved. This information is deemed reliable, but not guaranteed. The data relating to real estate displayed on this display comes in part from the IDX Program of PrimeMLS. The information being provided is for consumers’ personal, non-commercial use and may not be used for any purpose other than to identify prospective properties consumers may be interested in purchasing.