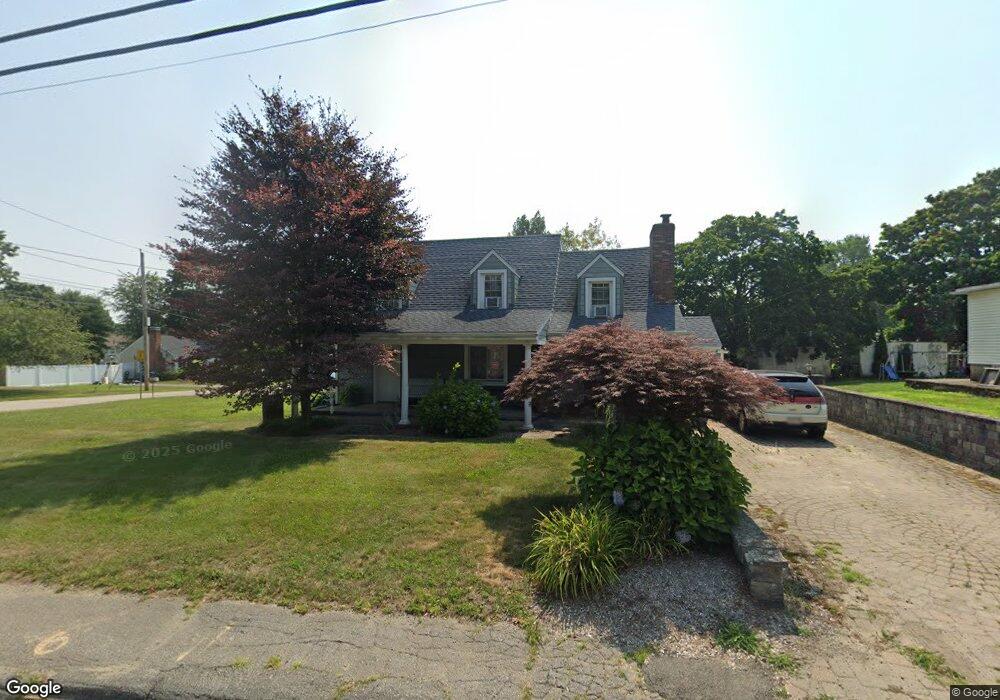
81 Anthony St Seekonk, MA 02771
Monroes-South Seekonk NeighborhoodEstimated Value: $535,000 - $602,000
5
Beds
4
Baths
2,561
Sq Ft
$222/Sq Ft
Est. Value
About This Home
This home is located at 81 Anthony St, Seekonk, MA 02771 and is currently estimated at $567,943, approximately $221 per square foot. 81 Anthony St is a home located in Bristol County with nearby schools including Seekonk High School, St Mary Academy-Bay View, and Providence Country Day School.
Ownership History
Date
Name
Owned For
Owner Type
Purchase Details
Closed on
Nov 1, 2006
Sold by
Shaw Jason W and Shaw Lisa M
Bought by
Watson Barbara A and Watson Ernest N
Current Estimated Value
Home Financials for this Owner
Home Financials are based on the most recent Mortgage that was taken out on this home.
Original Mortgage
$285,000
Outstanding Balance
$171,033
Interest Rate
6.47%
Mortgage Type
Purchase Money Mortgage
Estimated Equity
$396,910
Create a Home Valuation Report for This Property
The Home Valuation Report is an in-depth analysis detailing your home's value as well as a comparison with similar homes in the area
Home Values in the Area
Average Home Value in this Area
Purchase History
| Date | Buyer | Sale Price | Title Company |
|---|---|---|---|
| Watson Barbara A | -- | -- | |
| Shaw Jason W | $300,000 | -- |
Source: Public Records
Mortgage History
| Date | Status | Borrower | Loan Amount |
|---|---|---|---|
| Open | Shaw Jason W | $285,000 |
Source: Public Records
Tax History Compared to Growth
Tax History
| Year | Tax Paid | Tax Assessment Tax Assessment Total Assessment is a certain percentage of the fair market value that is determined by local assessors to be the total taxable value of land and additions on the property. | Land | Improvement |
|---|---|---|---|---|
| 2025 | $5,578 | $451,700 | $149,600 | $302,100 |
| 2024 | $5,348 | $433,000 | $149,600 | $283,400 |
| 2023 | $4,856 | $370,400 | $126,900 | $243,500 |
| 2022 | $4,397 | $329,600 | $121,700 | $207,900 |
| 2021 | $4,230 | $311,700 | $106,500 | $205,200 |
| 2020 | $4,172 | $316,800 | $106,900 | $209,900 |
| 2019 | $3,935 | $301,300 | $101,900 | $199,400 |
| 2018 | $3,831 | $287,000 | $99,100 | $187,900 |
| 2017 | $3,944 | $293,000 | $96,700 | $196,300 |
| 2016 | $3,905 | $291,200 | $96,700 | $194,500 |
| 2015 | $3,788 | $286,300 | $96,700 | $189,600 |
Source: Public Records
Map
Nearby Homes