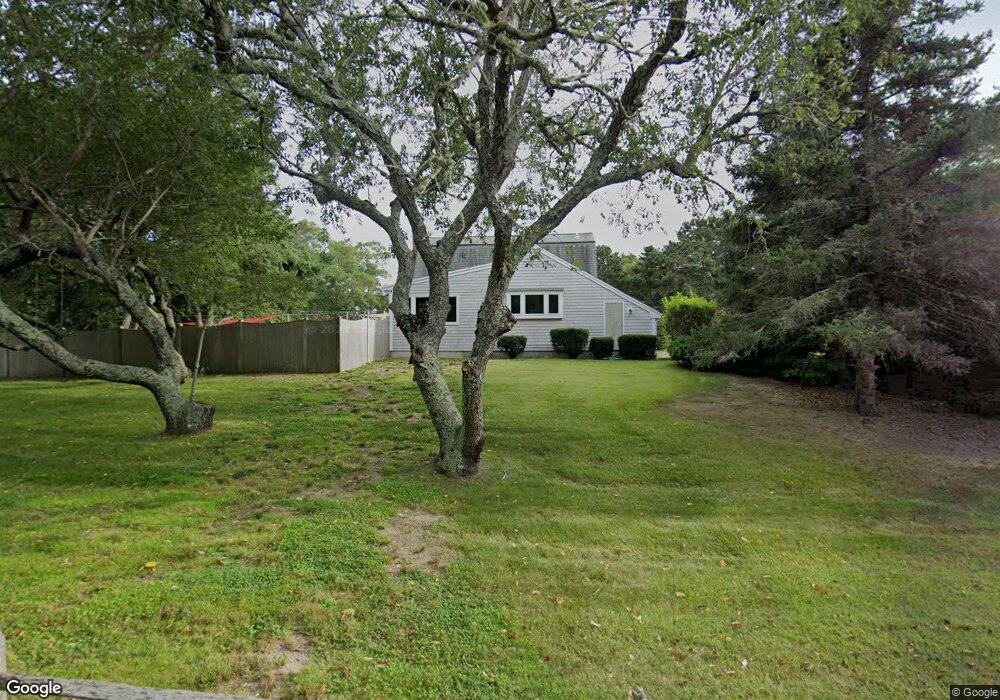
81 Blue Rock Rd South Yarmouth, MA 02664
South Yarmouth NeighborhoodEstimated Value: $649,000 - $728,000
3
Beds
3
Baths
1,835
Sq Ft
$378/Sq Ft
Est. Value
About This Home
This home is located at 81 Blue Rock Rd, South Yarmouth, MA 02664 and is currently estimated at $694,459, approximately $378 per square foot. 81 Blue Rock Rd is a home located in Barnstable County with nearby schools including Dennis-Yarmouth Regional High School and St. Pius X. School.
Ownership History
Date
Name
Owned For
Owner Type
Purchase Details
Closed on
Nov 21, 2016
Sold by
Rounds Arthur E and Rounds Carole A
Bought by
Seymour Benedict G and Seymour Christina M
Current Estimated Value
Home Financials for this Owner
Home Financials are based on the most recent Mortgage that was taken out on this home.
Original Mortgage
$315,000
Outstanding Balance
$252,890
Interest Rate
3.42%
Mortgage Type
New Conventional
Estimated Equity
$441,569
Create a Home Valuation Report for This Property
The Home Valuation Report is an in-depth analysis detailing your home's value as well as a comparison with similar homes in the area
Home Values in the Area
Average Home Value in this Area
Purchase History
| Date | Buyer | Sale Price | Title Company |
|---|---|---|---|
| Seymour Benedict G | $315,000 | -- |
Source: Public Records
Mortgage History
| Date | Status | Borrower | Loan Amount |
|---|---|---|---|
| Open | Seymour Benedict G | $315,000 |
Source: Public Records
Tax History Compared to Growth
Tax History
| Year | Tax Paid | Tax Assessment Tax Assessment Total Assessment is a certain percentage of the fair market value that is determined by local assessors to be the total taxable value of land and additions on the property. | Land | Improvement |
|---|---|---|---|---|
| 2025 | $3,877 | $547,600 | $180,600 | $367,000 |
| 2024 | $3,552 | $481,300 | $152,600 | $328,700 |
| 2023 | $3,594 | $443,200 | $132,100 | $311,100 |
| 2022 | $3,653 | $397,900 | $120,000 | $277,900 |
| 2021 | $3,304 | $345,600 | $120,000 | $225,600 |
| 2020 | $3,301 | $330,100 | $120,000 | $210,100 |
| 2019 | $3,158 | $312,700 | $120,000 | $192,700 |
| 2018 | $4,740 | $294,900 | $102,200 | $192,700 |
| 2017 | $2,911 | $290,500 | $97,800 | $192,700 |
| 2016 | $2,810 | $281,600 | $88,900 | $192,700 |
| 2015 | $2,865 | $285,400 | $88,900 | $196,500 |
Source: Public Records
Map
Nearby Homes
- 85 Keel Cape Dr
- 91 Chipping Green Cir
- 17 Fairmount Rd
- 17 Fairmount Rd
- 62 Old Fish House Rd
- 23 Fairwood Rd
- 21 Green Way
- 30 Pebble Beach Way
- 129 Driftwood Ln
- 7 Vinland Dr
- 4 Old Colony Way
- 6 Hawthorn St
- 118 Driftwood Ln
- 10 Upton Rd
- 10 Joanne Dr
- 25 Skerry Rd
- 1 Norseman Dr
- 176 Beacon St
- 401 Main St Unit 201
- 401 Main St Unit 101
- 71 Blue Rock Rd
- 91 Blue Rock Rd
- 14 S Dennis Rd
- 11 Scenic Dr
- 65 Blue Rock Rd
- 109 Blue Rock Rd
- 23 S Dennis Rd
- 7 Scenic Dr
- 70 Blue Rock Rd
- 24 S Dennis Rd
- 94 Blue Rock Rd
- 61 Blue Rock Rd
- 100 Blue Rock Rd
- 32 Joanna Dr
- 35 Joanna Dr
- 83 Midstream Dr
- 32 Jo-Anna Dr
- 35 S Dennis Rd
- 55 Blue Rock Rd Unit 57
- 55 Blue Rock Rd Unit 1