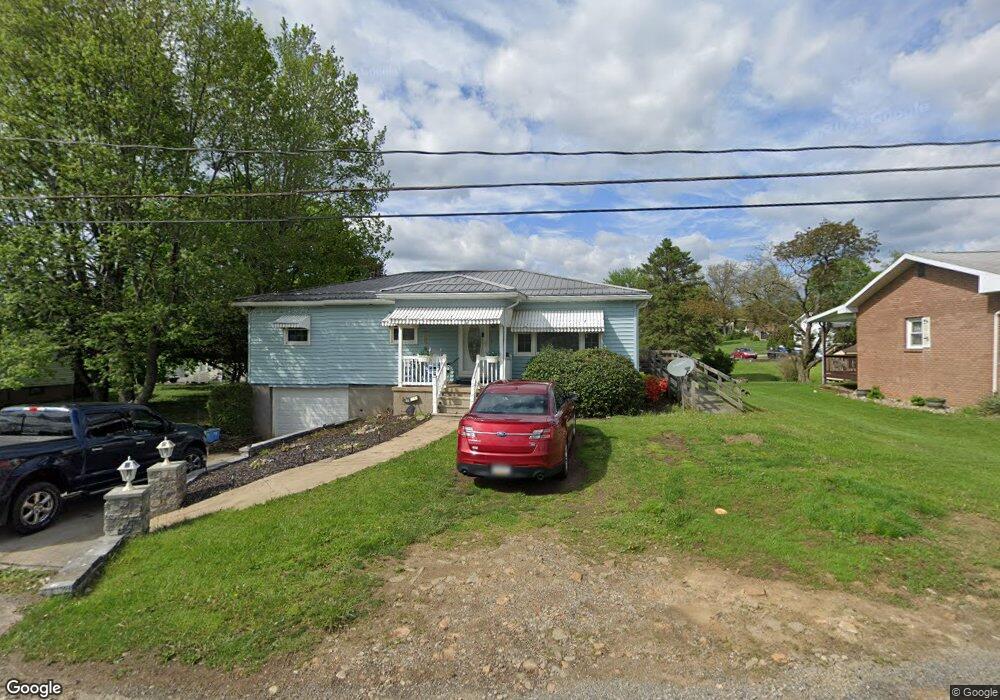
81 Bryant St Homer City, PA 15748
Estimated Value: $133,861 - $195,000
3
Beds
1
Bath
1,232
Sq Ft
$127/Sq Ft
Est. Value
About This Home
This home is located at 81 Bryant St, Homer City, PA 15748 and is currently estimated at $156,715, approximately $127 per square foot. 81 Bryant St is a home located in Indiana County with nearby schools including Homer-Center Elementary School and Homer-Center Junior/Senior High School.
Ownership History
Date
Name
Owned For
Owner Type
Purchase Details
Closed on
Jun 16, 2006
Sold by
Robertson Mary
Bought by
Turner Alfred T
Current Estimated Value
Home Financials for this Owner
Home Financials are based on the most recent Mortgage that was taken out on this home.
Original Mortgage
$85,500
Outstanding Balance
$56,112
Interest Rate
8.75%
Mortgage Type
Adjustable Rate Mortgage/ARM
Estimated Equity
$100,603
Purchase Details
Closed on
Aug 10, 2005
Sold by
Gabella Ann and Robertson Mary
Bought by
Gabella Ann
Create a Home Valuation Report for This Property
The Home Valuation Report is an in-depth analysis detailing your home's value as well as a comparison with similar homes in the area
Home Values in the Area
Average Home Value in this Area
Purchase History
| Date | Buyer | Sale Price | Title Company |
|---|---|---|---|
| Turner Alfred T | $95,000 | None Available | |
| Gabella Ann | -- | None Available |
Source: Public Records
Mortgage History
| Date | Status | Borrower | Loan Amount |
|---|---|---|---|
| Open | Turner Alfred T | $85,500 |
Source: Public Records
Tax History Compared to Growth
Tax History
| Year | Tax Paid | Tax Assessment Tax Assessment Total Assessment is a certain percentage of the fair market value that is determined by local assessors to be the total taxable value of land and additions on the property. | Land | Improvement |
|---|---|---|---|---|
| 2025 | $2,236 | $89,200 | $17,700 | $71,500 |
| 2024 | $2,200 | $89,200 | $17,700 | $71,500 |
| 2023 | $2,069 | $89,200 | $17,700 | $71,500 |
| 2022 | $2,047 | $89,200 | $17,700 | $71,500 |
| 2021 | $2,047 | $89,200 | $17,700 | $71,500 |
| 2020 | $2,006 | $89,200 | $17,700 | $71,500 |
| 2018 | $1,981 | $89,200 | $17,700 | $71,500 |
| 2017 | $1,625 | $89,200 | $17,700 | $71,500 |
| 2016 | -- | $89,200 | $17,700 | $71,500 |
| 2015 | -- | $16,070 | $1,280 | $14,790 |
| 2014 | -- | $16,070 | $1,280 | $14,790 |
Source: Public Records
Map
Nearby Homes