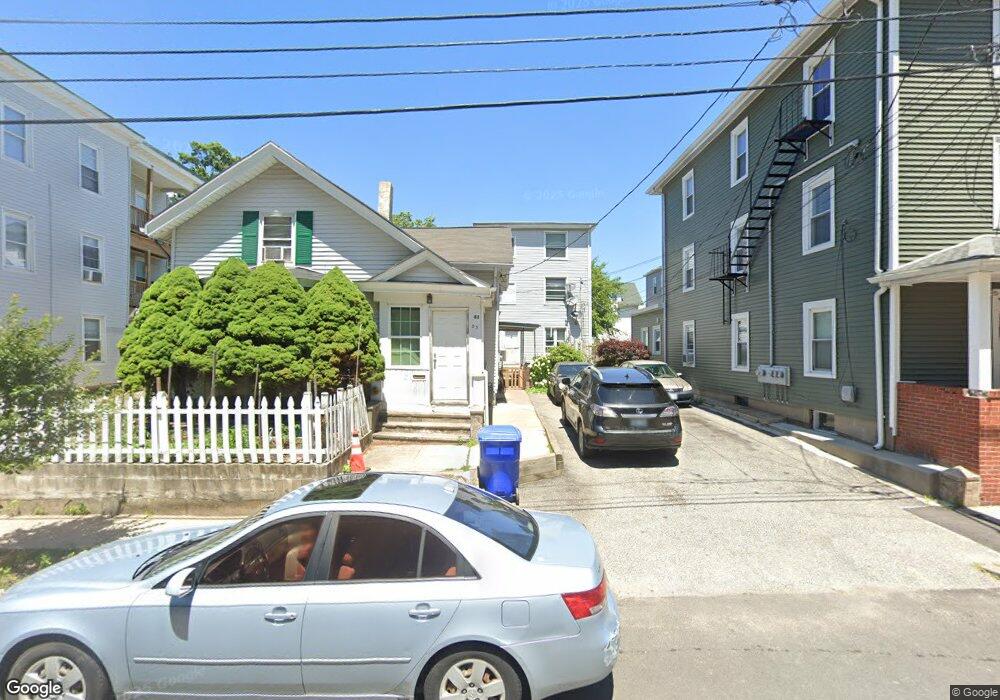
81 Capital St Pawtucket, RI 02860
Downtown Pawtucket NeighborhoodEstimated Value: $492,000 - $820,861
9
Beds
4
Baths
4,286
Sq Ft
$159/Sq Ft
Est. Value
About This Home
This home is located at 81 Capital St, Pawtucket, RI 02860 and is currently estimated at $682,620, approximately $159 per square foot. 81 Capital St is a home located in Providence County with nearby schools including International Charter School, Blackstone Valley Prep Junior High School, and Blackstone Academy Charter School.
Ownership History
Date
Name
Owned For
Owner Type
Purchase Details
Closed on
Nov 19, 1999
Sold by
Soucy Arthur R and Soucy Helene J
Bought by
Magnana Fredy F and Magnana Argelia
Current Estimated Value
Home Financials for this Owner
Home Financials are based on the most recent Mortgage that was taken out on this home.
Original Mortgage
$96,800
Outstanding Balance
$29,072
Interest Rate
7.76%
Mortgage Type
Commercial
Estimated Equity
$653,548
Create a Home Valuation Report for This Property
The Home Valuation Report is an in-depth analysis detailing your home's value as well as a comparison with similar homes in the area
Home Values in the Area
Average Home Value in this Area
Purchase History
| Date | Buyer | Sale Price | Title Company |
|---|---|---|---|
| Magnana Fredy F | $121,000 | -- |
Source: Public Records
Mortgage History
| Date | Status | Borrower | Loan Amount |
|---|---|---|---|
| Open | Magnana Fredy F | $96,800 |
Source: Public Records
Tax History Compared to Growth
Tax History
| Year | Tax Paid | Tax Assessment Tax Assessment Total Assessment is a certain percentage of the fair market value that is determined by local assessors to be the total taxable value of land and additions on the property. | Land | Improvement |
|---|---|---|---|---|
| 2025 | $8,302 | $631,300 | $118,800 | $512,500 |
| 2024 | $7,790 | $631,300 | $118,800 | $512,500 |
| 2023 | $7,452 | $439,900 | $53,500 | $386,400 |
| 2022 | $7,294 | $439,900 | $53,500 | $386,400 |
| 2021 | $7,294 | $439,900 | $53,500 | $386,400 |
| 2020 | $6,213 | $297,400 | $54,200 | $243,200 |
| 2019 | $6,213 | $297,400 | $54,200 | $243,200 |
| 2018 | $5,987 | $297,400 | $54,200 | $243,200 |
| 2017 | $5,405 | $237,900 | $41,200 | $196,700 |
| 2016 | $5,208 | $237,900 | $41,200 | $196,700 |
| 2015 | $5,208 | $237,900 | $41,200 | $196,700 |
| 2014 | $4,552 | $197,400 | $53,000 | $144,400 |
Source: Public Records
Map
Nearby Homes