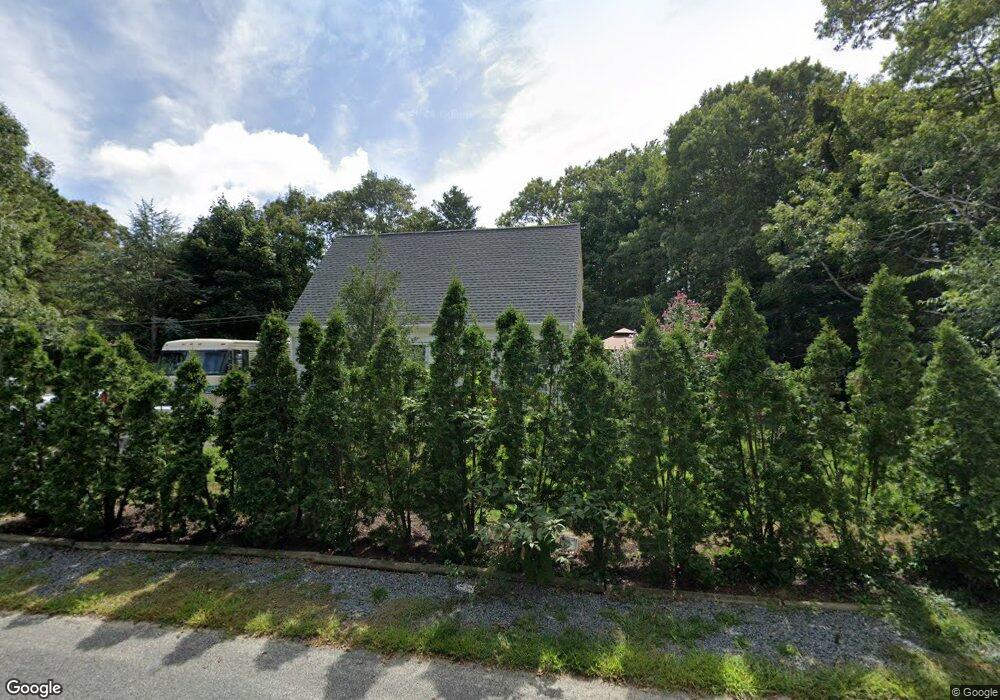
81 Charles St South Dennis, MA 02660
South Dennis NeighborhoodEstimated Value: $577,000 - $648,000
3
Beds
2
Baths
1,344
Sq Ft
$456/Sq Ft
Est. Value
About This Home
This home is located at 81 Charles St, South Dennis, MA 02660 and is currently estimated at $612,765, approximately $455 per square foot. 81 Charles St is a home located in Barnstable County with nearby schools including Dennis-Yarmouth Regional High School and St. Pius X. School.
Ownership History
Date
Name
Owned For
Owner Type
Purchase Details
Closed on
Sep 9, 1993
Sold by
Bolton Nicholas J and Bolton Cornelia A
Bought by
Poirier Edward J
Current Estimated Value
Home Financials for this Owner
Home Financials are based on the most recent Mortgage that was taken out on this home.
Original Mortgage
$90,500
Interest Rate
7.21%
Mortgage Type
Purchase Money Mortgage
Create a Home Valuation Report for This Property
The Home Valuation Report is an in-depth analysis detailing your home's value as well as a comparison with similar homes in the area
Home Values in the Area
Average Home Value in this Area
Purchase History
| Date | Buyer | Sale Price | Title Company |
|---|---|---|---|
| Poirier Edward J | $30,500 | -- |
Source: Public Records
Mortgage History
| Date | Status | Borrower | Loan Amount |
|---|---|---|---|
| Open | Poirier Edward J | $50,000 | |
| Open | Poirier Edward J | $143,000 | |
| Closed | Poirier Edward J | $143,500 | |
| Closed | Poirier Edward J | $90,500 |
Source: Public Records
Tax History Compared to Growth
Tax History
| Year | Tax Paid | Tax Assessment Tax Assessment Total Assessment is a certain percentage of the fair market value that is determined by local assessors to be the total taxable value of land and additions on the property. | Land | Improvement |
|---|---|---|---|---|
| 2025 | $2,135 | $493,000 | $134,500 | $358,500 |
| 2024 | $2,087 | $475,300 | $129,300 | $346,000 |
| 2023 | $2,038 | $436,400 | $117,500 | $318,900 |
| 2022 | $1,989 | $355,200 | $117,700 | $237,500 |
| 2021 | $1,847 | $306,300 | $115,300 | $191,000 |
| 2020 | $1,803 | $295,500 | $115,300 | $180,200 |
| 2019 | $1,772 | $287,200 | $124,400 | $162,800 |
| 2018 | $1,669 | $263,300 | $107,700 | $155,600 |
| 2017 | $1,619 | $263,300 | $107,700 | $155,600 |
| 2016 | $1,597 | $244,500 | $113,000 | $131,500 |
| 2015 | $1,565 | $244,500 | $113,000 | $131,500 |
| 2014 | $1,405 | $221,300 | $96,900 | $124,400 |
Source: Public Records
Map
Nearby Homes
- 153 Bayridge Dr
- 11 Uncle Stanleys Way
- 17 Margate Ln
- 4 Ebb Rd
- 15 Captain Jud Rd
- 17 Fairmount Rd
- 10 Joanne Dr
- 17 Fairmount Rd
- 118 Driftwood Ln
- 13 Covey Dr
- 25 Skerry Rd
- 7 Vinland Dr
- 129 Driftwood Ln
- 111 Merchant Ave
- 1 Norseman Dr
- 62 Old Fish House Rd
- 6 Hawthorn St
- 32 Captain Walsh Dr
- 6 Nimble Hill Dr
- 4 Old Colony Way