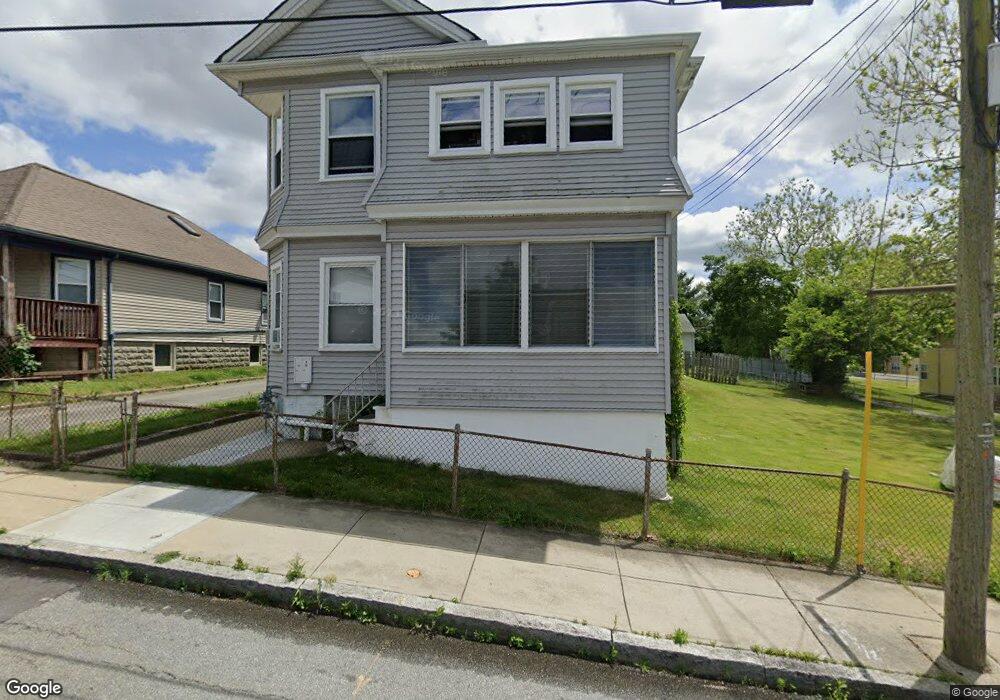
81 Duncan St Fall River, MA 02721
Maplewood NeighborhoodEstimated Value: $481,432 - $612,000
6
Beds
2
Baths
2,479
Sq Ft
$226/Sq Ft
Est. Value
About This Home
This home is located at 81 Duncan St, Fall River, MA 02721 and is currently estimated at $560,608, approximately $226 per square foot. 81 Duncan St is a home located in Bristol County with nearby schools including Letourneau Elementary School, Matthew J. Kuss Middle School, and B M C Durfee High School.
Ownership History
Date
Name
Owned For
Owner Type
Purchase Details
Closed on
Dec 16, 2020
Sold by
Machado Joseph
Bought by
Machado Keri L and Machado Joseph
Current Estimated Value
Purchase Details
Closed on
May 19, 1982
Bought by
Machado Joseph and Machado Geraldine M
Create a Home Valuation Report for This Property
The Home Valuation Report is an in-depth analysis detailing your home's value as well as a comparison with similar homes in the area
Home Values in the Area
Average Home Value in this Area
Purchase History
| Date | Buyer | Sale Price | Title Company |
|---|---|---|---|
| Machado Keri L | -- | None Available | |
| Machado Keri L | -- | None Available | |
| Machado Joseph | $45,000 | -- |
Source: Public Records
Mortgage History
| Date | Status | Borrower | Loan Amount |
|---|---|---|---|
| Previous Owner | Machado Joseph | $90,345 | |
| Previous Owner | Machado Joseph | $40,000 |
Source: Public Records
Tax History
| Year | Tax Paid | Tax Assessment Tax Assessment Total Assessment is a certain percentage of the fair market value that is determined by local assessors to be the total taxable value of land and additions on the property. | Land | Improvement |
|---|---|---|---|---|
| 2025 | $5,162 | $450,800 | $129,900 | $320,900 |
| 2024 | $4,733 | $411,900 | $124,900 | $287,000 |
| 2023 | $4,364 | $355,700 | $107,100 | $248,600 |
| 2022 | $4,007 | $317,500 | $97,400 | $220,100 |
| 2021 | $3,694 | $267,100 | $90,100 | $177,000 |
| 2020 | $3,312 | $229,200 | $86,200 | $143,000 |
| 2019 | $3,132 | $214,800 | $82,100 | $132,700 |
| 2018 | $2,895 | $198,000 | $80,600 | $117,400 |
| 2017 | $2,710 | $193,600 | $82,200 | $111,400 |
| 2016 | $2,650 | $194,400 | $85,600 | $108,800 |
| 2015 | $2,502 | $191,300 | $82,500 | $108,800 |
| 2014 | $2,574 | $204,600 | $86,800 | $117,800 |
Source: Public Records
Map
Nearby Homes
- 91 Duncan St
- 330 Miller St
- 346 Miller St
- 483 Stafford Rd
- 491 Stafford Rd
- 60 Duncan St
- 499 Stafford Rd Unit 501
- 499-501 Stafford Rd
- 469 Stafford Rd
- 515 Stafford Rd
- 374 Miller St
- 1607 Slade St
- 325 Miller St
- 343 Miller St
- 1589 Slade St
- 40 Duncan St
- 10 Wayne St
- 437 Stafford Rd
- 363 Miller St
- 1579 Slade St
Your Personal Tour Guide
Ask me questions while you tour the home.