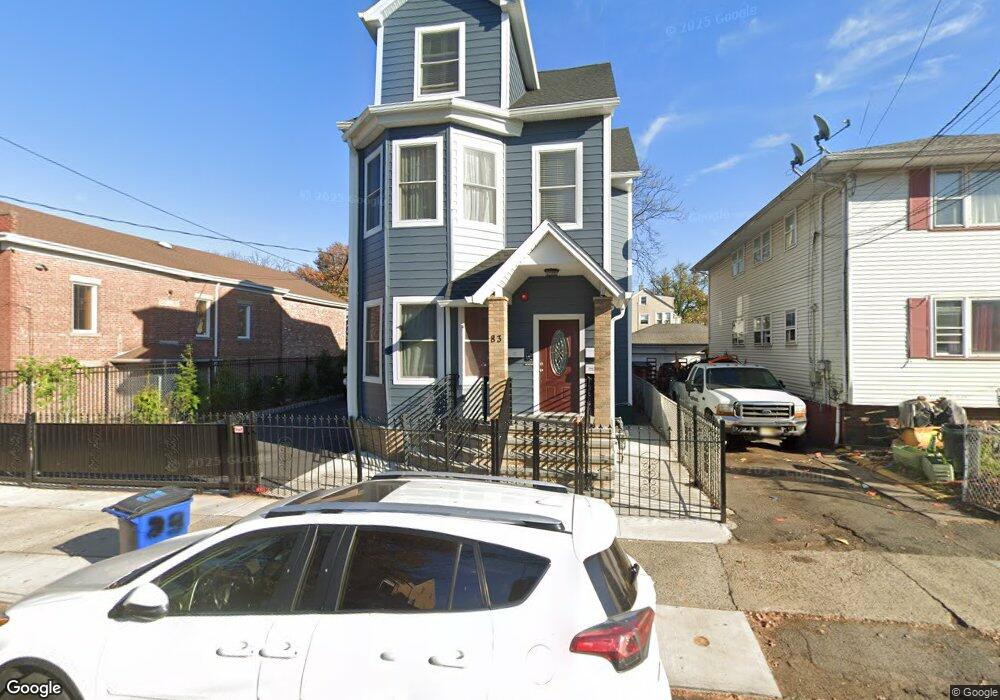
81 E 18th St Unit 83 Paterson, NJ 07524
Riverside NeighborhoodEstimated Value: $554,000 - $738,000
8
Beds
4
Baths
2,585
Sq Ft
$242/Sq Ft
Est. Value
About This Home
This home is located at 81 E 18th St Unit 83, Paterson, NJ 07524 and is currently estimated at $626,004, approximately $242 per square foot. 81 E 18th St Unit 83 is a home located in Passaic County with nearby schools including Edward W. Kilpatrick School of Discovery, Dale Avenue Elementary School, and Dr. Frank Napier, Jr. School of Technology.
Ownership History
Date
Name
Owned For
Owner Type
Purchase Details
Closed on
Apr 25, 2025
Sold by
Taveras David Rodriguez and Rodriguez David
Bought by
Davo Rt Llc
Current Estimated Value
Home Financials for this Owner
Home Financials are based on the most recent Mortgage that was taken out on this home.
Original Mortgage
$532,500
Outstanding Balance
$530,136
Interest Rate
6.65%
Mortgage Type
New Conventional
Estimated Equity
$95,868
Purchase Details
Closed on
Mar 22, 2022
Sold by
Guarionex Zapata
Bought by
Rodriguez David
Purchase Details
Closed on
Jun 24, 2004
Sold by
Russo Clara
Bought by
Zapata Guarionez
Home Financials for this Owner
Home Financials are based on the most recent Mortgage that was taken out on this home.
Original Mortgage
$346,750
Interest Rate
6.28%
Create a Home Valuation Report for This Property
The Home Valuation Report is an in-depth analysis detailing your home's value as well as a comparison with similar homes in the area
Home Values in the Area
Average Home Value in this Area
Purchase History
| Date | Buyer | Sale Price | Title Company |
|---|---|---|---|
| Davo Rt Llc | -- | None Listed On Document | |
| Davo Rt Llc | -- | None Listed On Document | |
| Rodriguez David | $415,000 | Wfg National Title | |
| Rodriguez David | $415,000 | Wfg National Title | |
| Zapata Guarionez | $365,000 | -- |
Source: Public Records
Mortgage History
| Date | Status | Borrower | Loan Amount |
|---|---|---|---|
| Open | Davo Rt Llc | $532,500 | |
| Closed | Davo Rt Llc | $532,500 | |
| Previous Owner | Zapata Guarionez | $346,750 |
Source: Public Records
Tax History
| Year | Tax Paid | Tax Assessment Tax Assessment Total Assessment is a certain percentage of the fair market value that is determined by local assessors to be the total taxable value of land and additions on the property. | Land | Improvement |
|---|---|---|---|---|
| 2025 | $13,578 | $231,500 | $53,100 | $178,400 |
| 2024 | $13,067 | $266,500 | $53,100 | $213,400 |
| 2022 | $12,371 | $266,500 | $53,100 | $213,400 |
| 2021 | $11,929 | $266,500 | $53,100 | $213,400 |
| 2020 | $11,126 | $266,500 | $53,100 | $213,400 |
| 2019 | $10,773 | $260,600 | $52,200 | $208,400 |
| 2018 | $10,162 | $234,900 | $51,800 | $183,100 |
| 2017 | $9,701 | $233,200 | $51,500 | $181,700 |
| 2016 | $10,674 | $246,000 | $54,000 | $192,000 |
| 2015 | $10,106 | $246,000 | $54,000 | $192,000 |
| 2014 | $13,558 | $467,500 | $184,800 | $282,700 |
Source: Public Records
Map
Nearby Homes
- 122 E 22nd St
- 100 3rd Ave Unit 6
- 205 Madison Ave Unit 209
- 205-209 Madison Ave
- 121 E 16th St
- 9 Madison Ave Unit 18
- 208-210 E 24th St
- 182 E 25th St
- 136 26th
- 117-119 E 26th St
- 174 E 16th St Unit 178
- 564 River St
- 28 Highland St
- 552 River St
- 263-267 E 25th St
- 263 E 25th St Unit 267
- 338 E 19th St
- 61 Sassafras St
- 7-02 Lake St Unit 1X
- 115 Butler St
- 83 E 18th St
- 85 E 18th St Unit 87
- 85-87 E 18th St
- 82 E 18th St
- 82 E 18th St Unit 84
- 82 E 18th St Unit 3
- 88-90 E 18th St
- 88 E 18th St Unit 90
- 82-84 E 18th St
- 82-84 E 18th St Unit 1
- 82-84 E 18th St Unit 3
- 84 E 18th St Unit 82
- 84 E 18th St Unit 86
- 93 E 18th St Unit 2
- 93 E 18th St
- 116 E 19th St Unit 118
- 106 E 19th St Unit 108
- 78 E 18th St Unit 80
- 112 E 19th St Unit 114
- 104 E 19th St
Your Personal Tour Guide
Ask me questions while you tour the home.