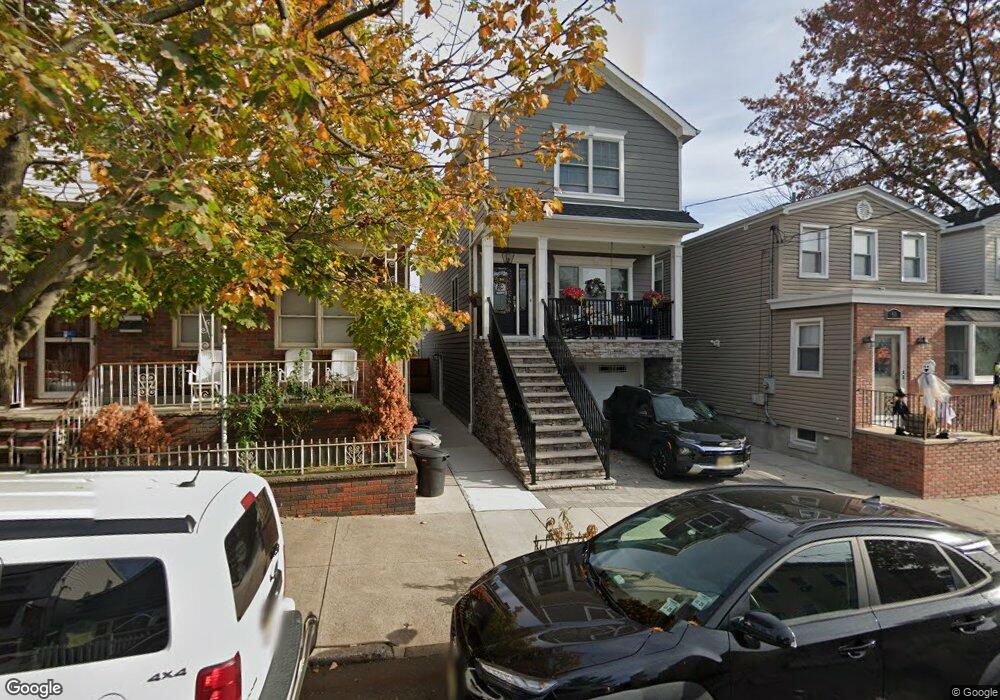
81 E 28th St Bayonne, NJ 07002
Constable Hook NeighborhoodEstimated Value: $741,000 - $1,024,000
--
Bed
--
Bath
2,286
Sq Ft
$382/Sq Ft
Est. Value
About This Home
This home is located at 81 E 28th St, Bayonne, NJ 07002 and is currently estimated at $873,275, approximately $382 per square foot. 81 E 28th St is a home located in Hudson County with nearby schools including Bayonne High School, Beacon Christian Academy, and Messiah Christian High School.
Ownership History
Date
Name
Owned For
Owner Type
Purchase Details
Closed on
Jun 17, 2015
Sold by
Davis Barbara Ann
Bought by
Ortiz Raymond and Vazquez Ortiz Daisy
Current Estimated Value
Home Financials for this Owner
Home Financials are based on the most recent Mortgage that was taken out on this home.
Original Mortgage
$7,224,821
Interest Rate
4.01%
Mortgage Type
FHA
Create a Home Valuation Report for This Property
The Home Valuation Report is an in-depth analysis detailing your home's value as well as a comparison with similar homes in the area
Home Values in the Area
Average Home Value in this Area
Purchase History
| Date | Buyer | Sale Price | Title Company |
|---|---|---|---|
| Ortiz Raymond | $120,000 | Fidelity Natl Title Ins Co | |
| Ortiz Raymond | $120,000 | None Available |
Source: Public Records
Mortgage History
| Date | Status | Borrower | Loan Amount |
|---|---|---|---|
| Previous Owner | Ortiz Raymond | $7,224,821 | |
| Previous Owner | Ortiz Raymond | $90,000 |
Source: Public Records
Tax History Compared to Growth
Tax History
| Year | Tax Paid | Tax Assessment Tax Assessment Total Assessment is a certain percentage of the fair market value that is determined by local assessors to be the total taxable value of land and additions on the property. | Land | Improvement |
|---|---|---|---|---|
| 2025 | $16,152 | $577,700 | $165,000 | $412,700 |
| 2024 | $15,500 | $577,700 | $165,000 | $412,700 |
| 2023 | $15,500 | $577,700 | $165,000 | $412,700 |
| 2022 | $11,951 | $453,900 | $0 | $0 |
| 2021 | $11,856 | $453,900 | $0 | $0 |
| 2020 | $11,647 | $453,900 | $0 | $0 |
| 2019 | $12,324 | $189,000 | $35,000 | $154,000 |
| 2018 | $12,078 | $189,000 | $35,000 | $154,000 |
| 2017 | $4,120 | $50,000 | $35,000 | $15,000 |
| 2016 | $6,070 | $76,500 | $35,000 | $41,500 |
| 2015 | $5,621 | $76,500 | $35,000 | $41,500 |
| 2014 | $5,445 | $76,500 | $35,000 | $41,500 |
Source: Public Records
Map
Nearby Homes