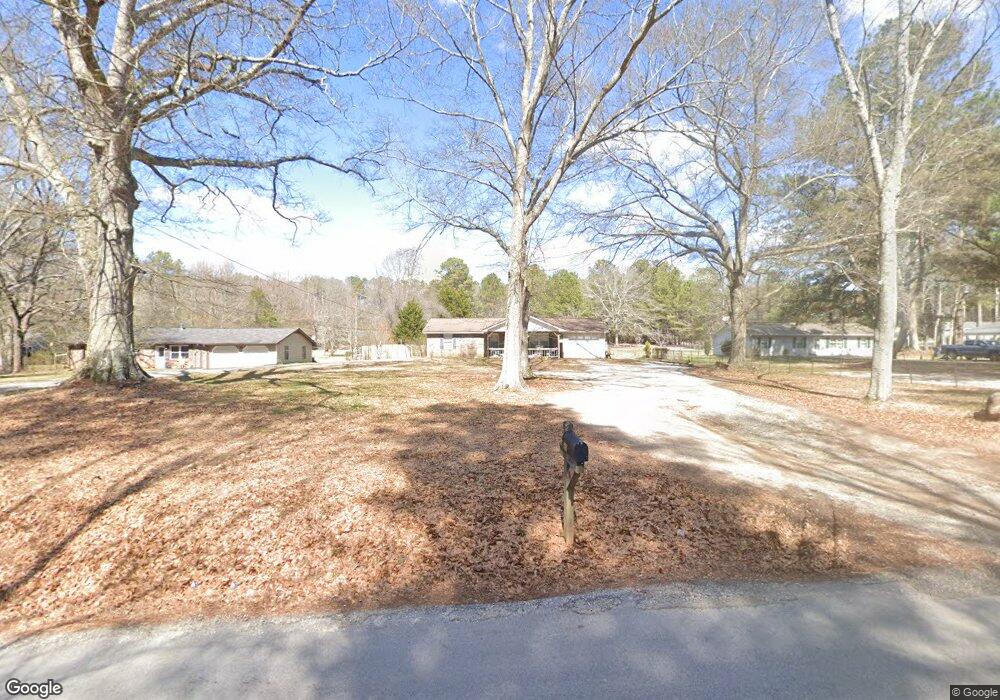
81 E Davis Bridge Rd Villa Rica, GA 30180
Abilene NeighborhoodEstimated Value: $248,000 - $277,612
3
Beds
2
Baths
1,310
Sq Ft
$202/Sq Ft
Est. Value
About This Home
This home is located at 81 E Davis Bridge Rd, Villa Rica, GA 30180 and is currently estimated at $264,653, approximately $202 per square foot. 81 E Davis Bridge Rd is a home located in Carroll County with nearby schools including Ithica Elementary School, Bay Springs Middle School, and Villa Rica High School.
Ownership History
Date
Name
Owned For
Owner Type
Purchase Details
Closed on
Jul 15, 2022
Sold by
Hinote Jeffery Hagen
Bought by
Hinote Jeffery Hagen and Hinote Maegan Taylor
Current Estimated Value
Home Financials for this Owner
Home Financials are based on the most recent Mortgage that was taken out on this home.
Original Mortgage
$156,000
Outstanding Balance
$149,264
Interest Rate
5.78%
Mortgage Type
New Conventional
Estimated Equity
$115,389
Purchase Details
Closed on
Jun 28, 2006
Sold by
Gardner James R
Bought by
Gardner James R
Home Financials for this Owner
Home Financials are based on the most recent Mortgage that was taken out on this home.
Original Mortgage
$95,000
Interest Rate
6.6%
Mortgage Type
New Conventional
Purchase Details
Closed on
Dec 16, 1996
Sold by
Jackson Kenny
Bought by
Gardner James R
Purchase Details
Closed on
Jun 11, 1984
Bought by
Jackson Kenny
Create a Home Valuation Report for This Property
The Home Valuation Report is an in-depth analysis detailing your home's value as well as a comparison with similar homes in the area
Home Values in the Area
Average Home Value in this Area
Purchase History
| Date | Buyer | Sale Price | Title Company |
|---|---|---|---|
| Hinote Jeffery Hagen | -- | -- | |
| Hinote Jeffery Hagen | $195,000 | -- | |
| Gardner James R | $100,000 | -- | |
| Gardner James R | $58,000 | -- | |
| Jackson Kenny | -- | -- |
Source: Public Records
Mortgage History
| Date | Status | Borrower | Loan Amount |
|---|---|---|---|
| Open | Hinote Jeffery Hagen | $156,000 | |
| Previous Owner | Gardner James R | $95,000 |
Source: Public Records
Tax History Compared to Growth
Tax History
| Year | Tax Paid | Tax Assessment Tax Assessment Total Assessment is a certain percentage of the fair market value that is determined by local assessors to be the total taxable value of land and additions on the property. | Land | Improvement |
|---|---|---|---|---|
| 2024 | $2,116 | $99,806 | $13,786 | $86,020 |
| 2023 | $2,116 | $91,736 | $11,029 | $80,707 |
| 2022 | $1,533 | $72,322 | $7,420 | $64,902 |
| 2021 | $1,433 | $64,759 | $5,936 | $58,823 |
| 2020 | $1,262 | $55,192 | $5,396 | $49,796 |
| 2019 | $1,228 | $52,789 | $5,396 | $47,393 |
| 2018 | $1,195 | $49,997 | $4,385 | $45,612 |
| 2017 | $1,292 | $55,188 | $4,385 | $50,803 |
| 2016 | $1,293 | $55,188 | $4,385 | $50,803 |
| 2015 | $1,243 | $48,463 | $4,266 | $44,198 |
| 2014 | $1,249 | $48,463 | $4,266 | $44,198 |
Source: Public Records
Map
Nearby Homes
- 240 River Oak Ct
- 1509 Pleasant Grove Church Rd
- 566 Clinton Dr
- 396 Lakeridge Dr
- 188 Lost Lake Trail
- 528 Clinton Dr
- 1687 NE Hickory Level Rd
- 0 Pleasant Oak Dr Unit 10610473
- 0 Pleasant Oak Dr Unit 148244
- 127 Autumn Run Place
- 390 Bar J Rd
- 1100 Pleasant Grove Church Rd
- 122 Blackstock Rd
- 128 W Lakeview Dr
- 408 Reagan Dr
- 241 Lost Lake Way
- 110 Lost Lake Trail
- 98 W Lakeview Dr
- 65 E Davis Bridge Rd
- 103 E Davis Bridge Rd
- 103 E Davis Bridge Rd
- 76 E Davis Bridge Rd 0 Unit 1
- 76 Davis
- 89 E Davis Bridge Rd
- 0 E Davis Bridge Rd Unit 7170864
- 96 E Davis Bridge Rd
- 55 E Davis Bridge Rd
- 40 E Davis Bridge Rd
- 141 E Davis Bridge Rd
- 30 E Davis Bridge Rd
- 2331 Pleasant Grove Church Rd
- 2199 Pleasant Grove Church Rd
- 2278 Pleasant Grove Church Rd
- 2280 Pleasant Grove Church Rd
- 185 E Davis Bridge Rd
- 188 E Davis Bridge Rd
- 2350 Pleasant Grove Church Rd
- 2401 Pleasant Grove Church Rd