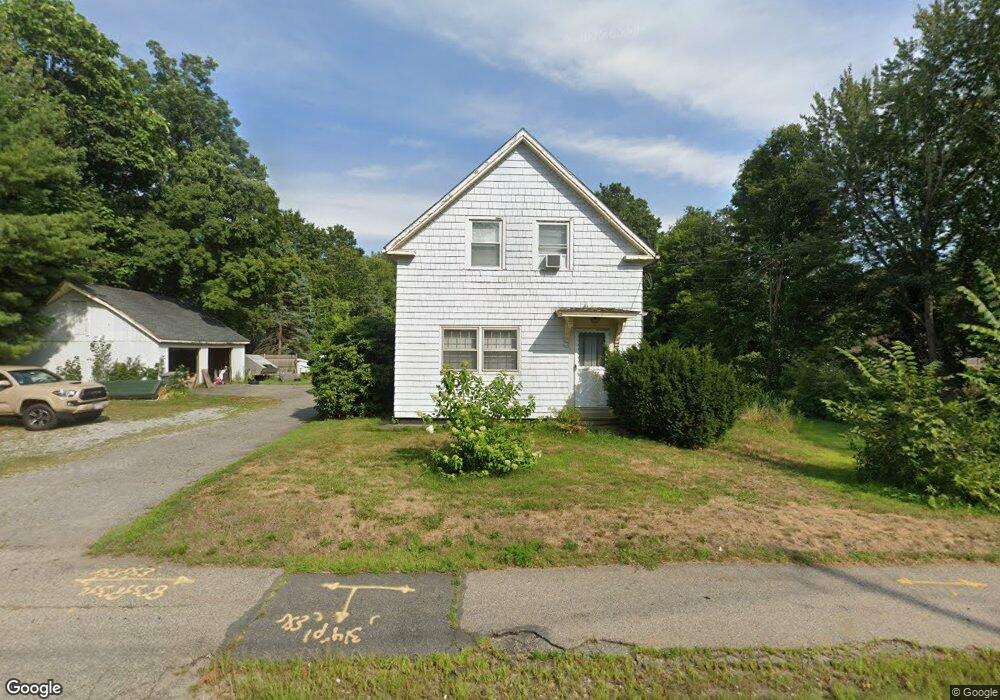
81 E Main St Westborough, MA 01581
Estimated Value: $552,000 - $638,000
3
Beds
2
Baths
1,638
Sq Ft
$363/Sq Ft
Est. Value
About This Home
This home is located at 81 E Main St, Westborough, MA 01581 and is currently estimated at $595,041, approximately $363 per square foot. 81 E Main St is a home located in Worcester County with nearby schools including Westborough High School, Ebridge Montessori School, and Westboro Knowledge Beginnings.
Ownership History
Date
Name
Owned For
Owner Type
Purchase Details
Closed on
Aug 28, 2009
Sold by
Chern Wen Foo and Chern Yvonne
Bought by
Dufresne Gary E
Current Estimated Value
Home Financials for this Owner
Home Financials are based on the most recent Mortgage that was taken out on this home.
Original Mortgage
$265,109
Outstanding Balance
$173,204
Interest Rate
5.17%
Mortgage Type
Purchase Money Mortgage
Estimated Equity
$421,837
Purchase Details
Closed on
May 26, 2006
Sold by
Kim Jung Soo
Bought by
Chern Wen-Foo and Chern Yvonne
Purchase Details
Closed on
Jun 8, 2004
Sold by
Kim Seung Kyu
Bought by
Kim Jung Soo
Purchase Details
Closed on
Jun 25, 2002
Sold by
Perrault Herbert F and Perrault Linda M
Bought by
Kim Seung K and Kim Jung S
Home Financials for this Owner
Home Financials are based on the most recent Mortgage that was taken out on this home.
Original Mortgage
$163,750
Interest Rate
6.81%
Mortgage Type
Purchase Money Mortgage
Create a Home Valuation Report for This Property
The Home Valuation Report is an in-depth analysis detailing your home's value as well as a comparison with similar homes in the area
Home Values in the Area
Average Home Value in this Area
Purchase History
| Date | Buyer | Sale Price | Title Company |
|---|---|---|---|
| Dufresne Gary E | $270,000 | -- | |
| Chern Wen-Foo | $350,000 | -- | |
| Kim Jung Soo | -- | -- | |
| Kim Seung K | $260,000 | -- |
Source: Public Records
Mortgage History
| Date | Status | Borrower | Loan Amount |
|---|---|---|---|
| Open | Dufresne Gary E | $265,109 | |
| Previous Owner | Kim Seung K | $163,750 |
Source: Public Records
Tax History
| Year | Tax Paid | Tax Assessment Tax Assessment Total Assessment is a certain percentage of the fair market value that is determined by local assessors to be the total taxable value of land and additions on the property. | Land | Improvement |
|---|---|---|---|---|
| 2025 | $7,889 | $484,300 | $267,800 | $216,500 |
| 2024 | $7,293 | $444,400 | $233,900 | $210,500 |
| 2023 | $8,496 | $504,500 | $316,400 | $188,100 |
| 2022 | $8,104 | $438,300 | $254,600 | $183,700 |
| 2021 | $7,640 | $412,100 | $228,400 | $183,700 |
| 2020 | $7,443 | $406,300 | $237,200 | $169,100 |
| 2019 | $7,165 | $390,900 | $237,200 | $153,700 |
| 2018 | $6,361 | $344,600 | $221,900 | $122,700 |
| 2017 | $6,134 | $344,600 | $221,900 | $122,700 |
| 2016 | $5,852 | $329,300 | $211,000 | $118,300 |
| 2015 | $6,053 | $325,600 | $211,000 | $114,600 |
Source: Public Records
Map
Nearby Homes
- 23 Water St
- 7 Mayberry Dr Unit H
- 53 Robin Rd
- 64 Milk St
- 4203 Peters Farm Way Unit 4203
- 44 South St
- 5 Wessonville Village Way Unit 5
- 165 Turnpike Rd Unit 7
- 70 South St
- 196 -198 Turnpike Rd
- 147 Milk St Unit 18
- 18 Fairview Rd
- 155 Milk St Unit 27
- 4 W End Ave
- 37 Oneil Dr
- 34 Harvey Ln
- 26 Mount Pleasant St
- 194 Milk St
- 2306 Talbot Way Unit 2306
- 6312 Peters Farm Way Unit 6312
Your Personal Tour Guide
Ask me questions while you tour the home.