Estimated Value: $260,000 - $284,000
3
Beds
1
Bath
1,056
Sq Ft
$259/Sq Ft
Est. Value
About This Home
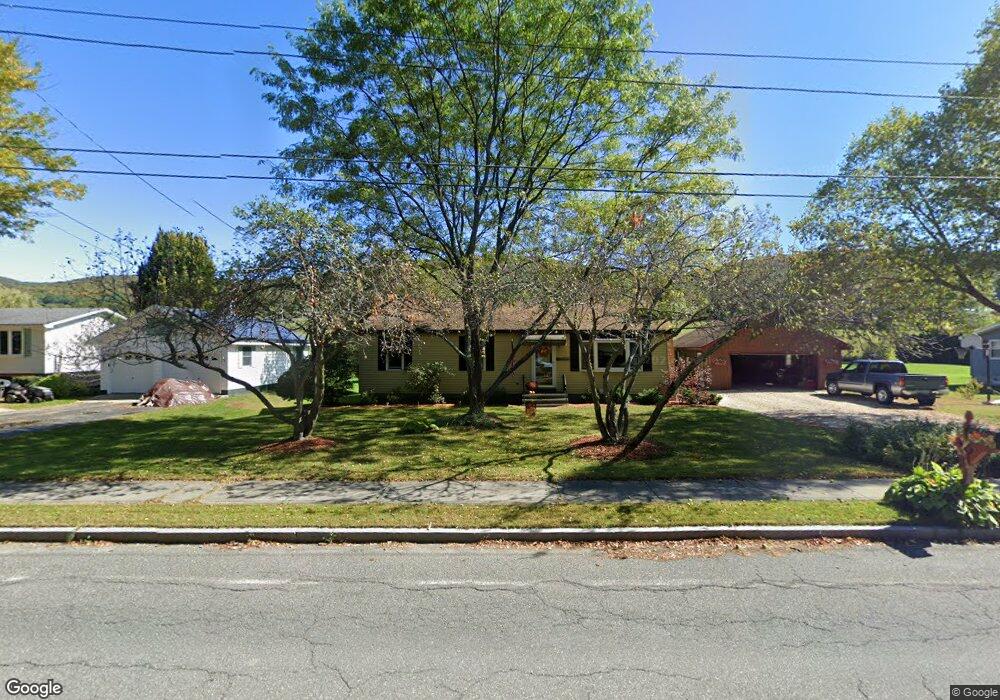
This home is located at 81 East Rd, Adams, MA 01220 and is currently estimated at $273,646, approximately $259 per square foot. 81 East Rd is a home located in Berkshire County with nearby schools including Hoosac Valley Middle & High School, Berkshire Arts & Technology Charter Public School, and St. Stanislaus Kostka School.
Ownership History
Date
Name
Owned For
Owner Type
Purchase Details
Closed on
Jul 5, 2016
Sold by
Middlebrook Dana P and Middlebrook Joan I
Bought by
Dubis Kimberley A
Current Estimated Value
Purchase Details
Closed on
Jun 10, 1977
Bought by
Middlebrook Dana P and Middlebrook Joan I
Create a Home Valuation Report for This Property
The Home Valuation Report is an in-depth analysis detailing your home's value as well as a comparison with similar homes in the area
Home Values in the Area
Average Home Value in this Area
Purchase History
| Date | Buyer | Sale Price | Title Company |
|---|---|---|---|
| Dubis Kimberley A | -- | -- | |
| Middlebrook Dana P | -- | -- |
Source: Public Records
Mortgage History
| Date | Status | Borrower | Loan Amount |
|---|---|---|---|
| Previous Owner | Middlebrook Dana P | $15,000 | |
| Previous Owner | Middlebrook Dana P | $15,000 | |
| Previous Owner | Middlebrook Dana P | $43,000 | |
| Previous Owner | Middlebrook Dana P | $11,300 |
Source: Public Records
Tax History
| Year | Tax Paid | Tax Assessment Tax Assessment Total Assessment is a certain percentage of the fair market value that is determined by local assessors to be the total taxable value of land and additions on the property. | Land | Improvement |
|---|---|---|---|---|
| 2025 | $3,967 | $233,200 | $63,500 | $169,700 |
| 2024 | $3,759 | $214,300 | $59,700 | $154,600 |
| 2023 | $3,550 | $191,400 | $54,300 | $137,100 |
| 2022 | $3,403 | $162,900 | $47,200 | $115,700 |
| 2021 | $2,631 | $148,600 | $47,200 | $101,400 |
| 2020 | $3,245 | $148,300 | $47,400 | $100,900 |
| 2019 | $2,628 | $148,300 | $47,400 | $100,900 |
| 2018 | $2,729 | $156,000 | $47,400 | $108,600 |
| 2017 | $3,334 | $156,000 | $47,400 | $108,600 |
| 2016 | $3,020 | $141,200 | $47,400 | $93,800 |
| 2015 | $2,962 | $138,600 | $49,500 | $89,100 |
| 2014 | $2,765 | $138,600 | $49,500 | $89,100 |
Source: Public Records
Map
Nearby Homes
Your Personal Tour Guide
Ask me questions while you tour the home.