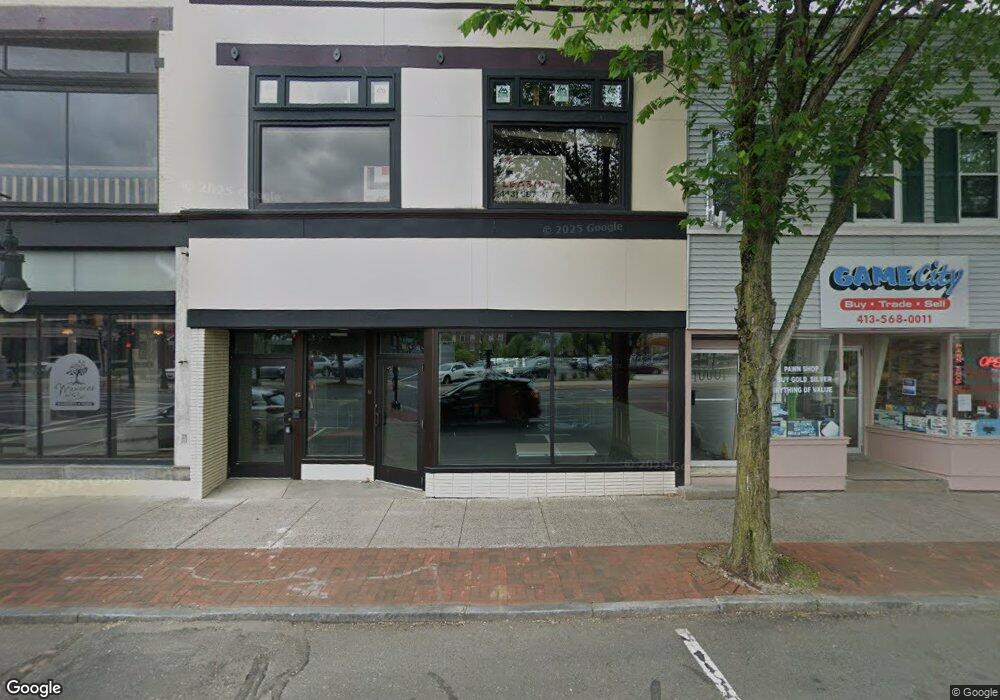
81 Elm St Westfield, MA 01085
--
Bed
1
Bath
2,808
Sq Ft
3,485
Sq Ft Lot
About This Home
This home is located at 81 Elm St, Westfield, MA 01085. 81 Elm St is a home located in Hampden County with nearby schools including Westfield High School and Saint Mary High School.
Ownership History
Date
Name
Owned For
Owner Type
Purchase Details
Closed on
Feb 11, 2020
Sold by
Borowski Eugene J
Bought by
Lambson Square Properties
Purchase Details
Closed on
Jul 8, 2019
Sold by
Whiteway Brian E
Bought by
Borowski Eugene J
Purchase Details
Closed on
Nov 12, 2002
Sold by
Elm Street Billiards I
Bought by
Whiteway Brian E and Whiteway Mary Jo M
Home Financials for this Owner
Home Financials are based on the most recent Mortgage that was taken out on this home.
Original Mortgage
$268,000
Interest Rate
6.04%
Mortgage Type
Commercial
Purchase Details
Closed on
Mar 12, 1998
Sold by
Janis Charles S and Janis Helen T
Bought by
Elm St Billiards Inc
Home Financials for this Owner
Home Financials are based on the most recent Mortgage that was taken out on this home.
Original Mortgage
$95,000
Interest Rate
7.03%
Mortgage Type
Commercial
Create a Home Valuation Report for This Property
The Home Valuation Report is an in-depth analysis detailing your home's value as well as a comparison with similar homes in the area
Home Values in the Area
Average Home Value in this Area
Purchase History
| Date | Buyer | Sale Price | Title Company |
|---|---|---|---|
| Lambson Square Properties | -- | None Available | |
| Borowski Eugene J | $275,000 | -- | |
| Whiteway Brian E | $92,162 | -- | |
| Elm St Billiards Inc | $100,000 | -- |
Source: Public Records
Mortgage History
| Date | Status | Borrower | Loan Amount |
|---|---|---|---|
| Previous Owner | Elm St Billiards Inc | $268,000 | |
| Previous Owner | Elm St Billiards Inc | $95,000 |
Source: Public Records
Tax History Compared to Growth
Tax History
| Year | Tax Paid | Tax Assessment Tax Assessment Total Assessment is a certain percentage of the fair market value that is determined by local assessors to be the total taxable value of land and additions on the property. | Land | Improvement |
|---|---|---|---|---|
| 2025 | $4,361 | $149,500 | $41,000 | $108,500 |
| 2024 | $4,398 | $140,100 | $37,200 | $102,900 |
| 2023 | $42 | $125,300 | $35,500 | $89,800 |
| 2022 | $4,208 | $115,900 | $31,700 | $84,200 |
| 2021 | $4,240 | $116,000 | $31,800 | $84,200 |
| 2020 | $4,305 | $116,000 | $31,800 | $84,200 |
| 2019 | $4,204 | $110,800 | $30,300 | $80,500 |
| 2018 | $4,010 | $108,900 | $30,300 | $78,600 |
| 2017 | $3,901 | $105,200 | $30,300 | $74,900 |
| 2016 | $3,859 | $105,200 | $30,300 | $74,900 |
| 2015 | $3,518 | $101,400 | $30,300 | $71,100 |
| 2014 | $3,431 | $101,400 | $30,300 | $71,100 |
Source: Public Records
Map
Nearby Homes