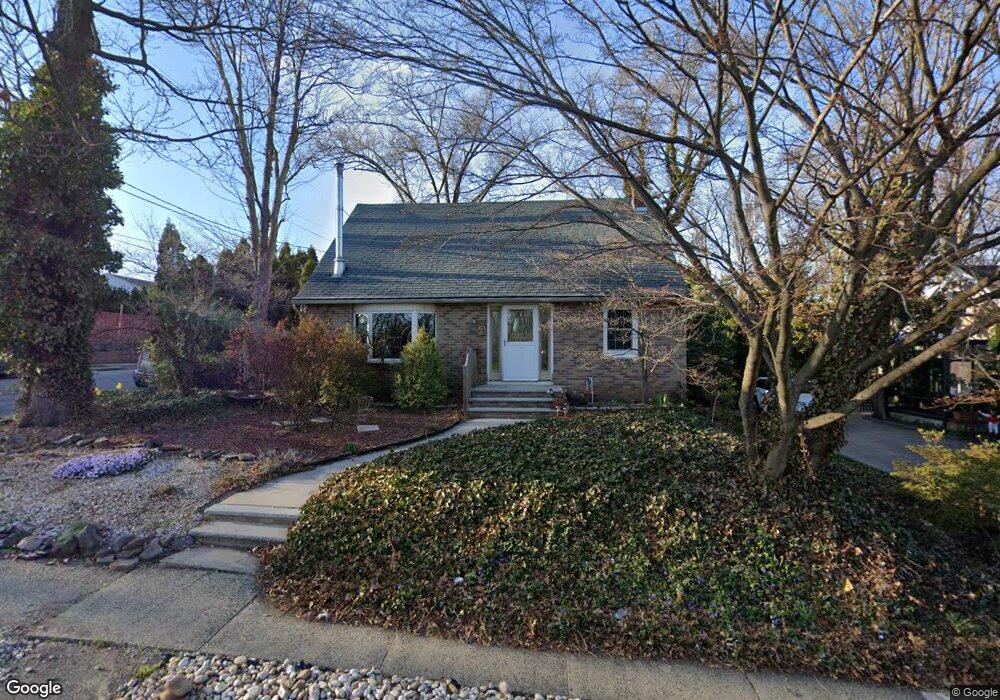
81 Ferris St South River, NJ 08882
Estimated Value: $483,000 - $556,000
--
Bed
--
Bath
1,612
Sq Ft
$323/Sq Ft
Est. Value
About This Home
This home is located at 81 Ferris St, South River, NJ 08882 and is currently estimated at $520,003, approximately $322 per square foot. 81 Ferris St is a home located in Middlesex County with nearby schools including South River Primary School, South River Elementary School, and South River Middle School.
Ownership History
Date
Name
Owned For
Owner Type
Purchase Details
Closed on
Oct 19, 2001
Sold by
Okun Jay
Bought by
Massaro Ken
Current Estimated Value
Home Financials for this Owner
Home Financials are based on the most recent Mortgage that was taken out on this home.
Original Mortgage
$202,500
Interest Rate
7.08%
Purchase Details
Closed on
Sep 8, 1998
Sold by
Nesher Renee
Bought by
Okun Jay
Home Financials for this Owner
Home Financials are based on the most recent Mortgage that was taken out on this home.
Original Mortgage
$113,500
Interest Rate
6.9%
Purchase Details
Closed on
Apr 13, 1995
Sold by
Fontinell Mary
Bought by
Nesser Renee
Create a Home Valuation Report for This Property
The Home Valuation Report is an in-depth analysis detailing your home's value as well as a comparison with similar homes in the area
Home Values in the Area
Average Home Value in this Area
Purchase History
| Date | Buyer | Sale Price | Title Company |
|---|---|---|---|
| Massaro Ken | $232,500 | -- | |
| Okun Jay | $142,500 | -- | |
| Nesser Renee | $128,000 | -- |
Source: Public Records
Mortgage History
| Date | Status | Borrower | Loan Amount |
|---|---|---|---|
| Previous Owner | Massaro Ken | $202,500 | |
| Previous Owner | Okun Jay | $113,500 |
Source: Public Records
Tax History Compared to Growth
Tax History
| Year | Tax Paid | Tax Assessment Tax Assessment Total Assessment is a certain percentage of the fair market value that is determined by local assessors to be the total taxable value of land and additions on the property. | Land | Improvement |
|---|---|---|---|---|
| 2025 | $8,097 | $327,700 | $145,000 | $182,700 |
| 2024 | $7,847 | $327,700 | $145,000 | $182,700 |
| 2023 | $7,847 | $327,700 | $145,000 | $182,700 |
| 2022 | $7,707 | $327,700 | $145,000 | $182,700 |
| 2021 | $5,515 | $327,700 | $145,000 | $182,700 |
| 2020 | $7,245 | $327,700 | $145,000 | $182,700 |
| 2019 | $7,339 | $89,100 | $22,500 | $66,600 |
| 2018 | $6,913 | $89,100 | $22,500 | $66,600 |
| 2017 | $6,651 | $89,100 | $22,500 | $66,600 |
| 2016 | $6,640 | $89,100 | $22,500 | $66,600 |
| 2015 | $6,241 | $89,100 | $22,500 | $66,600 |
| 2014 | $6,092 | $89,100 | $22,500 | $66,600 |
Source: Public Records
Map
Nearby Homes