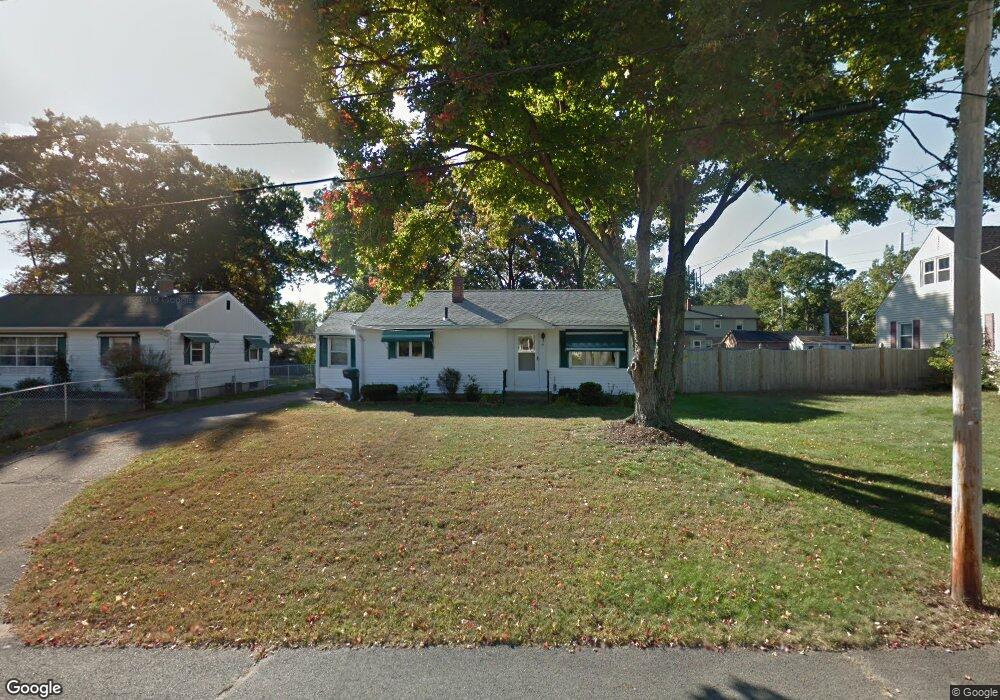
81 Frink St Chicopee, MA 01020
Fairview NeighborhoodEstimated Value: $277,000 - $310,414
3
Beds
1
Bath
936
Sq Ft
$309/Sq Ft
Est. Value
About This Home
This home is located at 81 Frink St, Chicopee, MA 01020 and is currently estimated at $289,604, approximately $309 per square foot. 81 Frink St is a home located in Hampden County with nearby schools including Streiber Elementary School, Fairview Middle School, and Chicopee Comprehensive High School.
Ownership History
Date
Name
Owned For
Owner Type
Purchase Details
Closed on
Feb 8, 2021
Sold by
Paquette Jeffrey P and Cheatles Linda
Bought by
Parker William M and Parker Christina A
Current Estimated Value
Home Financials for this Owner
Home Financials are based on the most recent Mortgage that was taken out on this home.
Original Mortgage
$187,900
Outstanding Balance
$167,764
Interest Rate
2.6%
Mortgage Type
Purchase Money Mortgage
Estimated Equity
$121,840
Create a Home Valuation Report for This Property
The Home Valuation Report is an in-depth analysis detailing your home's value as well as a comparison with similar homes in the area
Home Values in the Area
Average Home Value in this Area
Purchase History
| Date | Buyer | Sale Price | Title Company |
|---|---|---|---|
| Parker William M | $227,900 | None Available |
Source: Public Records
Mortgage History
| Date | Status | Borrower | Loan Amount |
|---|---|---|---|
| Open | Parker William M | $187,900 |
Source: Public Records
Tax History Compared to Growth
Tax History
| Year | Tax Paid | Tax Assessment Tax Assessment Total Assessment is a certain percentage of the fair market value that is determined by local assessors to be the total taxable value of land and additions on the property. | Land | Improvement |
|---|---|---|---|---|
| 2025 | $3,513 | $231,700 | $104,700 | $127,000 |
| 2024 | $3,336 | $226,000 | $102,600 | $123,400 |
| 2023 | $3,106 | $205,000 | $93,300 | $111,700 |
| 2022 | $2,983 | $175,600 | $81,100 | $94,500 |
| 2021 | $2,881 | $163,600 | $73,700 | $89,900 |
| 2020 | $2,795 | $160,100 | $75,800 | $84,300 |
| 2019 | $2,929 | $154,500 | $75,800 | $78,700 |
| 2018 | $2,725 | $148,800 | $72,100 | $76,700 |
| 2017 | $2,579 | $149,000 | $67,200 | $81,800 |
| 2016 | $2,535 | $149,900 | $67,200 | $82,700 |
| 2015 | $2,489 | $141,900 | $67,200 | $74,700 |
| 2014 | $1,244 | $141,900 | $67,200 | $74,700 |
Source: Public Records
Map
Nearby Homes
- 442 Prospect St
- 519 Prospect St
- 592 Prospect St
- 157 Pendleton Ave
- 141 Boulay Cir
- 64 Dowds Ln
- 55 Dowds Ln
- 21 Tourtelotte Ave
- 63-65 Mosher St
- 861 Prospect St
- 130 Middle Water St
- 246 E Dwight St
- 15 Riverview Place
- 48 N Canal St
- 39 Fernwood St
- 34 Deslauriers St
- 201 Clemente St
- 205 Clemente St
- 3 Ralph Ave
- 20 Mount Carmel Ave