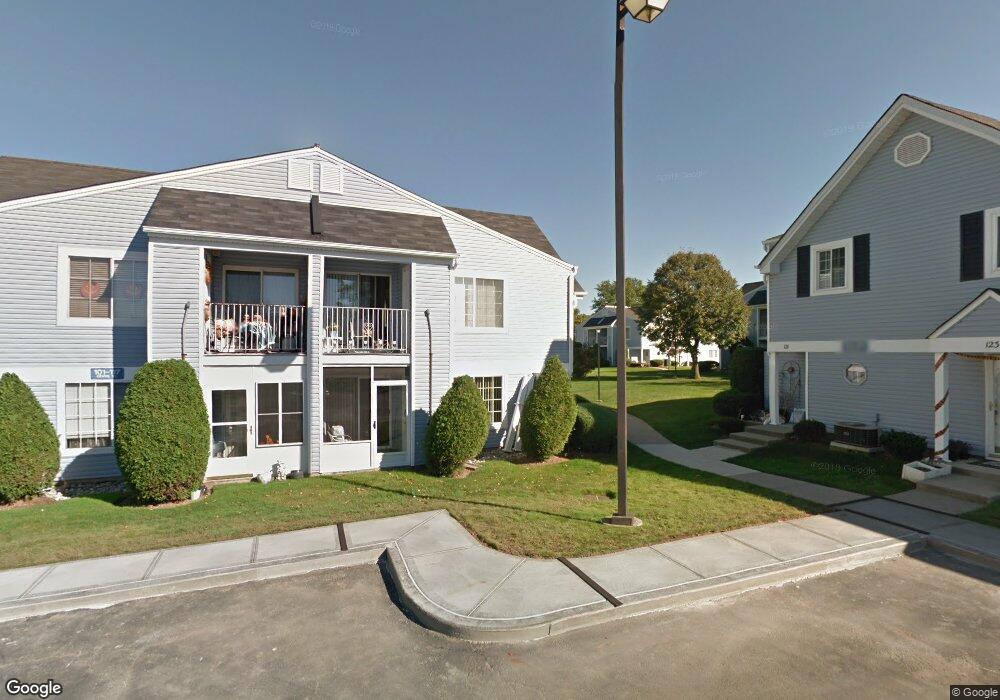
81 Gervil St Unit 2 Staten Island, NY 10309
Rossville NeighborhoodEstimated Value: $475,000 - $508,000
2
Beds
1
Bath
924
Sq Ft
$528/Sq Ft
Est. Value
About This Home
This home is located at 81 Gervil St Unit 2, Staten Island, NY 10309 and is currently estimated at $487,649, approximately $527 per square foot. 81 Gervil St Unit 2 is a home located in Richmond County with nearby schools including P.S. 56 - The Louis Desario School, Is 34 Tottenville, and Tottenville High School.
Ownership History
Date
Name
Owned For
Owner Type
Purchase Details
Closed on
Dec 22, 2022
Sold by
Spinella Joseph
Bought by
Mancini Sabrina
Current Estimated Value
Home Financials for this Owner
Home Financials are based on the most recent Mortgage that was taken out on this home.
Original Mortgage
$360,000
Outstanding Balance
$348,506
Interest Rate
6.61%
Mortgage Type
New Conventional
Estimated Equity
$139,143
Purchase Details
Closed on
Mar 29, 2007
Sold by
Maklari Dennis and Maklari Linda
Bought by
Spinella Joseph and Spinella Linda
Home Financials for this Owner
Home Financials are based on the most recent Mortgage that was taken out on this home.
Original Mortgage
$232,960
Interest Rate
7.5%
Mortgage Type
Purchase Money Mortgage
Create a Home Valuation Report for This Property
The Home Valuation Report is an in-depth analysis detailing your home's value as well as a comparison with similar homes in the area
Home Values in the Area
Average Home Value in this Area
Purchase History
| Date | Buyer | Sale Price | Title Company |
|---|---|---|---|
| Mancini Sabrina | $450,000 | The Security Title Guarantee | |
| Spinella Joseph | $291,200 | None Available |
Source: Public Records
Mortgage History
| Date | Status | Borrower | Loan Amount |
|---|---|---|---|
| Open | Mancini Sabrina | $360,000 | |
| Previous Owner | Spinella Joseph | $232,960 |
Source: Public Records
Tax History Compared to Growth
Tax History
| Year | Tax Paid | Tax Assessment Tax Assessment Total Assessment is a certain percentage of the fair market value that is determined by local assessors to be the total taxable value of land and additions on the property. | Land | Improvement |
|---|---|---|---|---|
| 2025 | $3,900 | $21,408 | $3,039 | $18,369 |
| 2024 | $3,900 | $21,081 | $3,062 | $18,019 |
| 2023 | $3,720 | $18,318 | $2,702 | $15,616 |
| 2022 | $3,163 | $20,080 | $3,325 | $16,755 |
| 2021 | $3,128 | $17,091 | $3,325 | $13,766 |
| 2020 | $3,155 | $17,546 | $3,325 | $14,221 |
| 2019 | $3,092 | $17,893 | $3,325 | $14,568 |
| 2018 | $2,814 | $15,265 | $2,762 | $12,503 |
| 2017 | $2,636 | $14,401 | $2,826 | $11,575 |
| 2016 | $2,406 | $13,586 | $2,793 | $10,793 |
| 2015 | $2,283 | $13,586 | $2,764 | $10,822 |
| 2014 | $2,283 | $13,484 | $3,114 | $10,370 |
Source: Public Records
Map
Nearby Homes
- 132 Gervil St Unit 2ndFl
- 132 Gervil St Unit 2fl
- 549 Correll Ave Unit 29
- 591 Correll Ave Unit 146
- 28 Berry Ct Unit 576
- 24 Berry Ct Unit 574
- 45 Redwood Loop
- 230 Gervil St
- 85 Cypress Loop
- 5 Wirt Ave
- 87 Cypress Loop Unit 243
- 739 Maguire Ave
- 234 Gervil St
- 47 Hemlock St
- 735 Maguire Ave
- 740 Maguire Ave
- 62 Arrowood Ct Unit 601
- 27 Berry Ct Unit 565
- 736 Maguire Ave
- 71 Bombay St
- 81 Gervil St Unit 93
- 67 Gervil St Unit 100
- 79 Gervil St Unit 94
- 69 Gervil St Unit 99
- 71 Gervil St Unit 98
- 75 Gervil St Unit Upper
- 75 Gervil St Unit 96
- 75 Gervil St Unit 2
- 73 Gervil St Unit 97
- 83 Gervil St Unit 92
- 48 Locust Ct
- 50 Locust Ct
- 65 Gervil St Unit 101
- 46 Locust Ct
- 52 Locust Ct
- 97 Gervil St
- 63 Gervil St Unit 102
- 95 Gervil St Unit 86
- 54 Locust Ct
- 44 Locust Ct