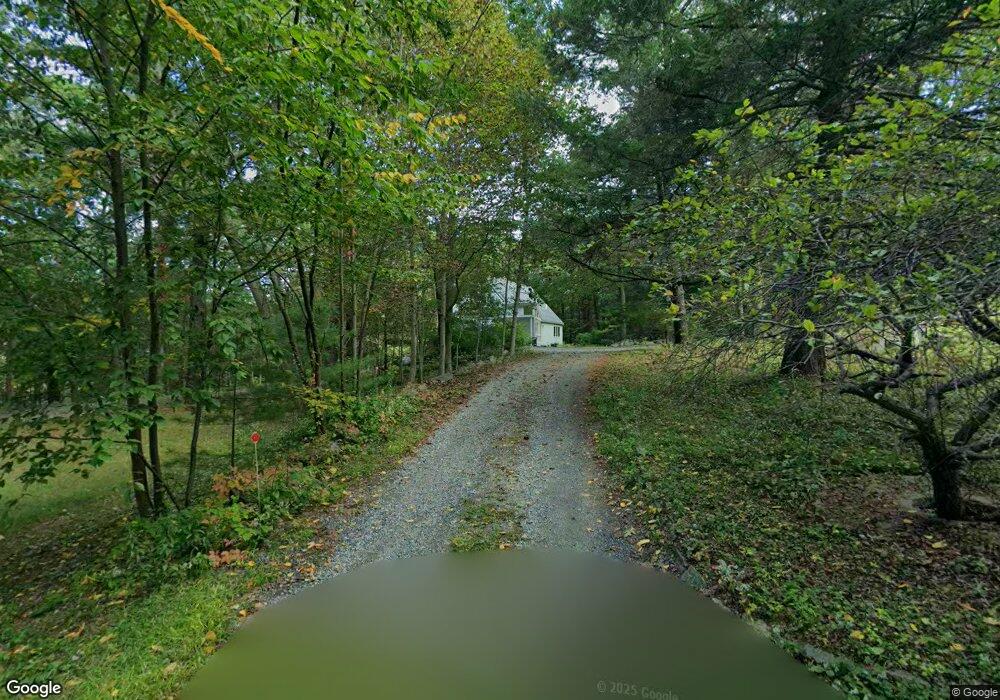
81 Hart St Beverly, MA 01915
Beverly Farms NeighborhoodEstimated Value: $1,126,000 - $1,469,000
3
Beds
2
Baths
2,020
Sq Ft
$629/Sq Ft
Est. Value
About This Home
This home is located at 81 Hart St, Beverly, MA 01915 and is currently estimated at $1,269,717, approximately $628 per square foot. 81 Hart St is a home located in Essex County with nearby schools including Beverly High School, Glen Urquhart School, and Tara Montessori School.
Ownership History
Date
Name
Owned For
Owner Type
Purchase Details
Closed on
Jun 19, 2024
Sold by
Kelly Noreen F and Tremblay George T
Bought by
Tremblay Madison K
Current Estimated Value
Purchase Details
Closed on
Jun 9, 1998
Sold by
Metayer Steven R and Metayer Valerie M
Bought by
Tremblay George T and Kelly Noreen F
Home Financials for this Owner
Home Financials are based on the most recent Mortgage that was taken out on this home.
Original Mortgage
$227,000
Interest Rate
7.05%
Mortgage Type
Purchase Money Mortgage
Purchase Details
Closed on
Feb 11, 1994
Sold by
Clemenzi Mark J and Clemenzi Debra
Bought by
Metayer Steven R and Metayer Valerie
Home Financials for this Owner
Home Financials are based on the most recent Mortgage that was taken out on this home.
Original Mortgage
$217,200
Interest Rate
7.08%
Mortgage Type
Purchase Money Mortgage
Create a Home Valuation Report for This Property
The Home Valuation Report is an in-depth analysis detailing your home's value as well as a comparison with similar homes in the area
Home Values in the Area
Average Home Value in this Area
Purchase History
| Date | Buyer | Sale Price | Title Company |
|---|---|---|---|
| Tremblay Madison K | -- | None Available | |
| Tremblay Madison K | -- | None Available | |
| Tremblay George T | $330,000 | -- | |
| Metayer Steven R | $271,500 | -- |
Source: Public Records
Mortgage History
| Date | Status | Borrower | Loan Amount |
|---|---|---|---|
| Previous Owner | Metayer Steven R | $227,000 | |
| Previous Owner | Metayer Steven R | $217,200 |
Source: Public Records
Tax History Compared to Growth
Tax History
| Year | Tax Paid | Tax Assessment Tax Assessment Total Assessment is a certain percentage of the fair market value that is determined by local assessors to be the total taxable value of land and additions on the property. | Land | Improvement |
|---|---|---|---|---|
| 2025 | $10,330 | $939,900 | $651,100 | $288,800 |
| 2024 | $10,079 | $897,500 | $614,700 | $282,800 |
| 2023 | $9,777 | $868,300 | $585,500 | $282,800 |
| 2022 | $8,810 | $723,900 | $439,700 | $284,200 |
| 2021 | $8,791 | $692,200 | $419,600 | $272,600 |
| 2020 | $8,601 | $670,400 | $397,800 | $272,600 |
| 2019 | $8,375 | $634,000 | $370,400 | $263,600 |
| 2018 | $8,626 | $634,300 | $396,000 | $238,300 |
| 2017 | $8,124 | $568,900 | $326,700 | $242,200 |
| 2016 | $8,186 | $568,900 | $326,700 | $242,200 |
| 2015 | $8,637 | $612,100 | $331,200 | $280,900 |
Source: Public Records
Map
Nearby Homes