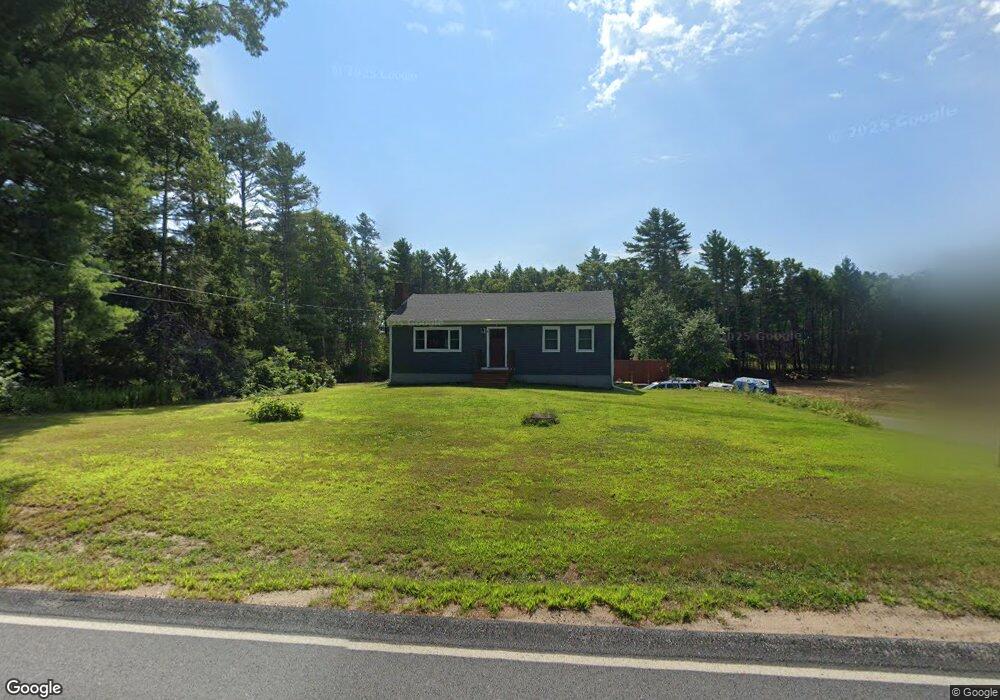
81 High St Carver, MA 02330
Estimated Value: $441,000 - $554,922
2
Beds
1
Bath
1,040
Sq Ft
$490/Sq Ft
Est. Value
About This Home
This home is located at 81 High St, Carver, MA 02330 and is currently estimated at $509,481, approximately $489 per square foot. 81 High St is a home located in Plymouth County with nearby schools including Carver Elementary School.
Ownership History
Date
Name
Owned For
Owner Type
Purchase Details
Closed on
May 23, 2025
Sold by
Mahan Brian and Mahan Joy
Bought by
Bj Mahan Ft and Mahan
Current Estimated Value
Purchase Details
Closed on
Apr 5, 2002
Sold by
Hickman Lloyd T
Bought by
Mahan Brian and Mahan Joyh
Purchase Details
Closed on
Jan 12, 1999
Sold by
Rogan Thomas J and Evans Patricia M
Bought by
Hickman Lloyd T
Purchase Details
Closed on
Jan 16, 1990
Sold by
Cook Russell E
Bought by
Evans Patricia M
Create a Home Valuation Report for This Property
The Home Valuation Report is an in-depth analysis detailing your home's value as well as a comparison with similar homes in the area
Home Values in the Area
Average Home Value in this Area
Purchase History
| Date | Buyer | Sale Price | Title Company |
|---|---|---|---|
| Bj Mahan Ft | -- | None Available | |
| Bj Mahan Ft | -- | None Available | |
| Mahan Brian | $210,000 | -- | |
| Mahan Brian | $210,000 | -- | |
| Hickman Lloyd T | $90,000 | -- | |
| Hickman Lloyd T | $90,000 | -- | |
| Evans Patricia M | $122,000 | -- | |
| Evans Patricia M | $122,000 | -- |
Source: Public Records
Mortgage History
| Date | Status | Borrower | Loan Amount |
|---|---|---|---|
| Previous Owner | Evans Patricia M | $274,346 | |
| Previous Owner | Evans Patricia M | $11,000 |
Source: Public Records
Tax History Compared to Growth
Tax History
| Year | Tax Paid | Tax Assessment Tax Assessment Total Assessment is a certain percentage of the fair market value that is determined by local assessors to be the total taxable value of land and additions on the property. | Land | Improvement |
|---|---|---|---|---|
| 2025 | $7,074 | $510,000 | $160,300 | $349,700 |
| 2024 | $6,675 | $471,100 | $157,100 | $314,000 |
| 2023 | $5,642 | $386,700 | $157,100 | $229,600 |
| 2022 | $5,321 | $333,000 | $134,300 | $198,700 |
| 2021 | $4,987 | $294,400 | $120,000 | $174,400 |
| 2020 | $4,753 | $276,500 | $112,100 | $164,400 |
| 2019 | $4,583 | $268,800 | $108,800 | $160,000 |
| 2018 | $4,122 | $233,800 | $108,800 | $125,000 |
| 2017 | $3,948 | $223,200 | $104,700 | $118,500 |
| 2016 | $3,629 | $213,100 | $99,700 | $113,400 |
| 2015 | $3,472 | $204,100 | $99,700 | $104,400 |
| 2014 | $3,611 | $212,300 | $126,100 | $86,200 |
Source: Public Records
Map
Nearby Homes