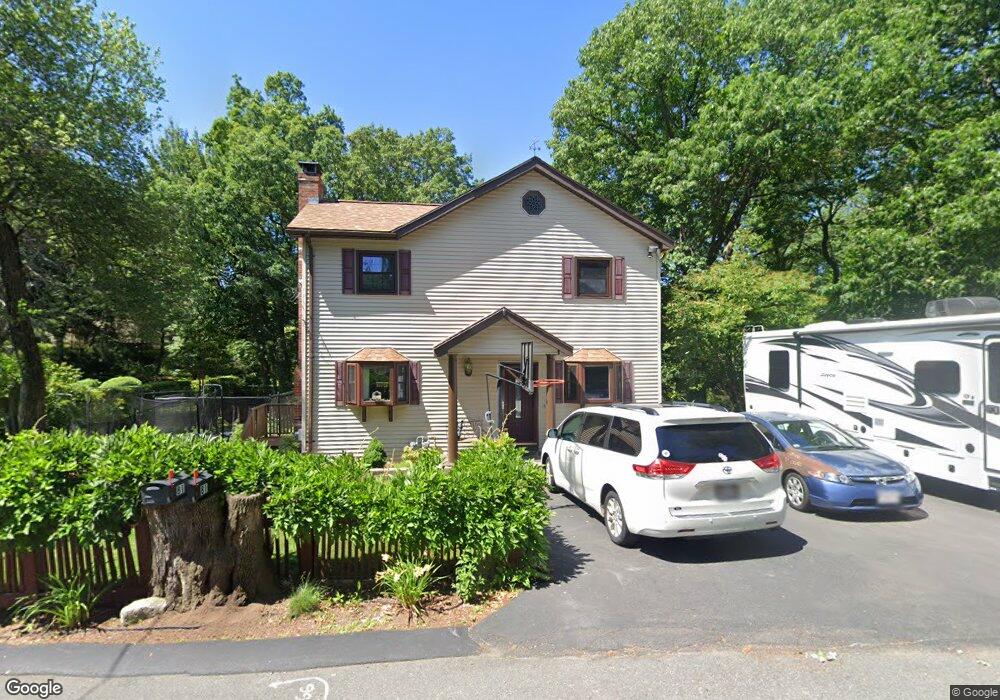
81 Hobson St Saugus, MA 01906
North Saugus NeighborhoodEstimated Value: $750,243 - $912,000
3
Beds
2
Baths
1,834
Sq Ft
$437/Sq Ft
Est. Value
About This Home
This home is located at 81 Hobson St, Saugus, MA 01906 and is currently estimated at $802,311, approximately $437 per square foot. 81 Hobson St is a home located in Essex County with nearby schools including Saugus High School, Pioneer Charter School Of Science II, and Our Lady Of Assumption School.
Ownership History
Date
Name
Owned For
Owner Type
Purchase Details
Closed on
Oct 15, 1996
Sold by
Pascucci Elena A and Pascucci Steven
Bought by
Dipiero Gary A and Taylor Tammy
Current Estimated Value
Home Financials for this Owner
Home Financials are based on the most recent Mortgage that was taken out on this home.
Original Mortgage
$195,000
Interest Rate
8.06%
Mortgage Type
Purchase Money Mortgage
Purchase Details
Closed on
May 11, 1988
Sold by
Davis Irene M
Bought by
Pascucci Steven A
Create a Home Valuation Report for This Property
The Home Valuation Report is an in-depth analysis detailing your home's value as well as a comparison with similar homes in the area
Home Values in the Area
Average Home Value in this Area
Purchase History
| Date | Buyer | Sale Price | Title Company |
|---|---|---|---|
| Dipiero Gary A | $195,000 | -- | |
| Pascucci Steven A | $92,500 | -- |
Source: Public Records
Mortgage History
| Date | Status | Borrower | Loan Amount |
|---|---|---|---|
| Open | Pascucci Steven A | $325,000 | |
| Closed | Pascucci Steven A | $195,000 | |
| Previous Owner | Pascucci Steven A | $132,000 | |
| Previous Owner | Pascucci Steven A | $148,000 |
Source: Public Records
Tax History
| Year | Tax Paid | Tax Assessment Tax Assessment Total Assessment is a certain percentage of the fair market value that is determined by local assessors to be the total taxable value of land and additions on the property. | Land | Improvement |
|---|---|---|---|---|
| 2025 | $7,088 | $663,700 | $373,200 | $290,500 |
| 2024 | $6,901 | $648,000 | $363,100 | $284,900 |
| 2023 | $6,706 | $595,600 | $318,100 | $277,500 |
| 2022 | $6,437 | $536,000 | $295,800 | $240,200 |
| 2021 | $5,790 | $469,200 | $245,800 | $223,400 |
| 2020 | $5,347 | $448,600 | $233,800 | $214,800 |
| 2019 | $5,330 | $437,600 | $222,800 | $214,800 |
| 2018 | $4,821 | $416,300 | $212,800 | $203,500 |
| 2017 | $4,571 | $379,300 | $202,800 | $176,500 |
| 2016 | $4,004 | $328,200 | $192,400 | $135,800 |
| 2015 | $3,759 | $312,700 | $183,400 | $129,300 |
| 2014 | $3,720 | $320,400 | $183,400 | $137,000 |
Source: Public Records
Map
Nearby Homes
- 7 Central St
- 227 Walnut St
- 9 Walden Pond Ave
- 29 Susan Dr
- 905 Sherwood Forest Ln
- 7 Nirvana Dr
- 24 Palmetto St
- 348 Lynn Fells Pkwy
- 38 Appleton St
- 148 Forest St
- 9 Broadway Unit 210
- 846 Broadway Unit 40
- 52 Hesper St
- 21 Athens Dr
- 115 Quinn Rd
- 62 Main St
- 4 Oneil Way
- 36 Jasper St
- 25 Auburn St
- 23 Orchard Ave