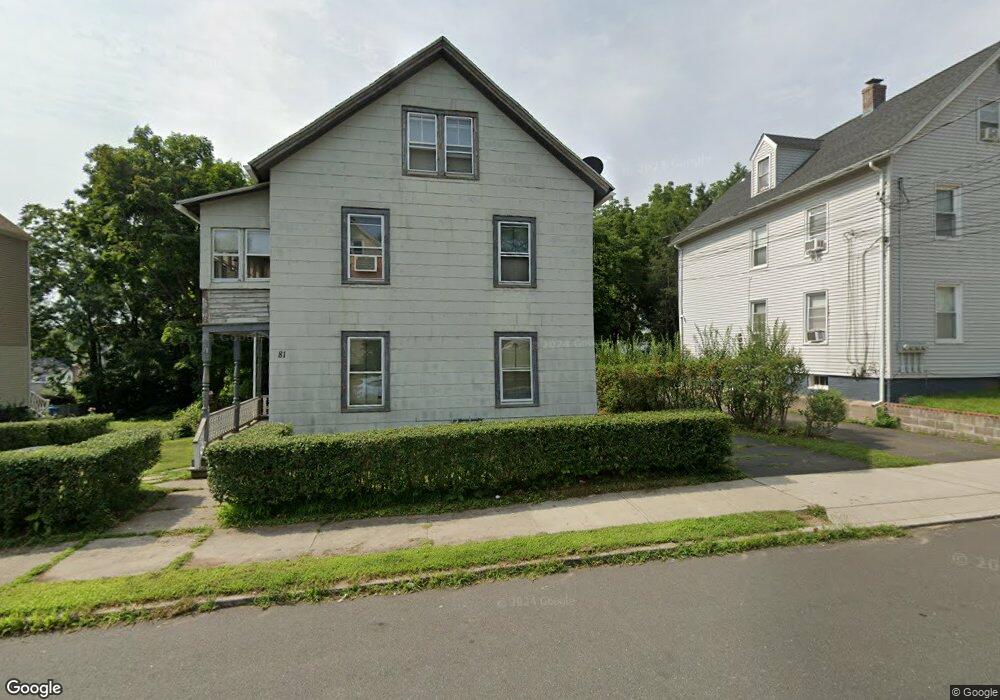
81 Jubilee St Unit 1 New Britain, CT 06051
Estimated Value: $258,000 - $292,000
2
Beds
1
Bath
1,440
Sq Ft
$193/Sq Ft
Est. Value
About This Home
This home is located at 81 Jubilee St Unit 1, New Britain, CT 06051 and is currently estimated at $278,068, approximately $193 per square foot. 81 Jubilee St Unit 1 is a home located in Hartford County with nearby schools including Chamberlain School, Pulaski Middle School, and Emmanuel Christian Academy.
Ownership History
Date
Name
Owned For
Owner Type
Purchase Details
Closed on
Sep 16, 2004
Sold by
Paganetti Dean
Bought by
Centurelli Anthony
Current Estimated Value
Home Financials for this Owner
Home Financials are based on the most recent Mortgage that was taken out on this home.
Original Mortgage
$76,000
Outstanding Balance
$38,003
Interest Rate
6.02%
Estimated Equity
$240,065
Purchase Details
Closed on
Jun 29, 2004
Sold by
Neiman Edward
Bought by
Paganetti Dean
Create a Home Valuation Report for This Property
The Home Valuation Report is an in-depth analysis detailing your home's value as well as a comparison with similar homes in the area
Home Values in the Area
Average Home Value in this Area
Purchase History
| Date | Buyer | Sale Price | Title Company |
|---|---|---|---|
| Centurelli Anthony | $95,000 | -- | |
| Paganetti Dean | $52,000 | -- |
Source: Public Records
Mortgage History
| Date | Status | Borrower | Loan Amount |
|---|---|---|---|
| Open | Paganetti Dean | $76,000 |
Source: Public Records
Tax History Compared to Growth
Tax History
| Year | Tax Paid | Tax Assessment Tax Assessment Total Assessment is a certain percentage of the fair market value that is determined by local assessors to be the total taxable value of land and additions on the property. | Land | Improvement |
|---|---|---|---|---|
| 2025 | $5,288 | $134,960 | $48,370 | $86,590 |
| 2024 | $5,343 | $134,960 | $48,370 | $86,590 |
| 2023 | $5,166 | $134,960 | $48,370 | $86,590 |
| 2022 | $3,964 | $80,080 | $22,260 | $57,820 |
| 2021 | $3,964 | $80,080 | $22,260 | $57,820 |
| 2020 | $4,044 | $80,080 | $22,260 | $57,820 |
| 2019 | $4,044 | $80,080 | $22,260 | $57,820 |
| 2018 | $4,044 | $80,080 | $22,260 | $57,820 |
| 2017 | $3,931 | $77,840 | $22,260 | $55,580 |
| 2016 | $3,931 | $77,840 | $22,260 | $55,580 |
| 2015 | $3,814 | $77,840 | $22,260 | $55,580 |
| 2014 | $3,814 | $77,840 | $22,260 | $55,580 |
Source: Public Records
Map
Nearby Homes