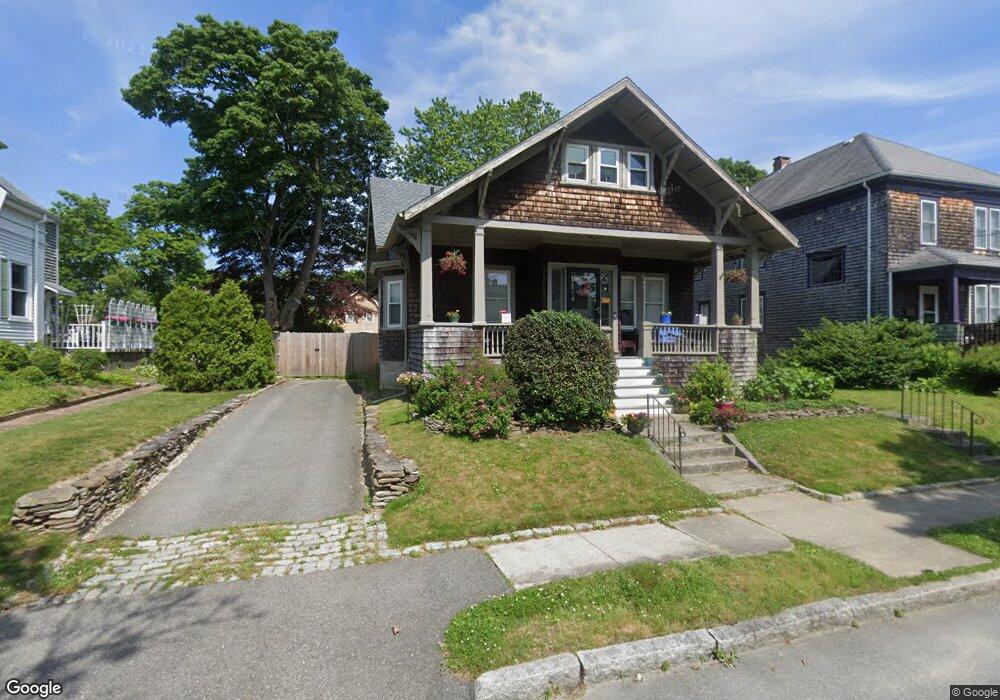
81 Laurel St Fairhaven, MA 02719
Estimated Value: $581,000 - $705,000
4
Beds
2
Baths
2,072
Sq Ft
$303/Sq Ft
Est. Value
About This Home
This home is located at 81 Laurel St, Fairhaven, MA 02719 and is currently estimated at $627,206, approximately $302 per square foot. 81 Laurel St is a home located in Bristol County with nearby schools including Fairhaven High School, City On A Hill Charter Public School New Bedford, and St. Joseph School.
Ownership History
Date
Name
Owned For
Owner Type
Purchase Details
Closed on
Nov 6, 2007
Sold by
81 Laurel Street T and Bryan Myra M
Bought by
Szynal Timothy P
Current Estimated Value
Home Financials for this Owner
Home Financials are based on the most recent Mortgage that was taken out on this home.
Original Mortgage
$266,950
Outstanding Balance
$169,337
Interest Rate
6.43%
Mortgage Type
Purchase Money Mortgage
Estimated Equity
$457,869
Create a Home Valuation Report for This Property
The Home Valuation Report is an in-depth analysis detailing your home's value as well as a comparison with similar homes in the area
Home Values in the Area
Average Home Value in this Area
Purchase History
| Date | Buyer | Sale Price | Title Company |
|---|---|---|---|
| Szynal Timothy P | $281,000 | -- |
Source: Public Records
Mortgage History
| Date | Status | Borrower | Loan Amount |
|---|---|---|---|
| Open | Szynal Timothy P | $266,950 |
Source: Public Records
Tax History
| Year | Tax Paid | Tax Assessment Tax Assessment Total Assessment is a certain percentage of the fair market value that is determined by local assessors to be the total taxable value of land and additions on the property. | Land | Improvement |
|---|---|---|---|---|
| 2025 | $42 | $446,600 | $242,400 | $204,200 |
| 2024 | $4,023 | $435,900 | $242,400 | $193,500 |
| 2023 | $3,882 | $390,200 | $209,100 | $181,100 |
| 2022 | $3,720 | $364,000 | $190,500 | $173,500 |
| 2021 | $3,670 | $313,200 | $173,200 | $140,000 |
| 2020 | $3,464 | $313,200 | $173,200 | $140,000 |
| 2019 | $3,234 | $277,100 | $148,400 | $128,700 |
| 2018 | $3,123 | $264,600 | $141,200 | $123,400 |
| 2017 | $3,011 | $251,800 | $135,900 | $115,900 |
| 2016 | $2,913 | $239,200 | $133,200 | $106,000 |
| 2015 | $2,887 | $237,600 | $133,200 | $104,400 |
Source: Public Records
Map
Nearby Homes
Your Personal Tour Guide
Ask me questions while you tour the home.