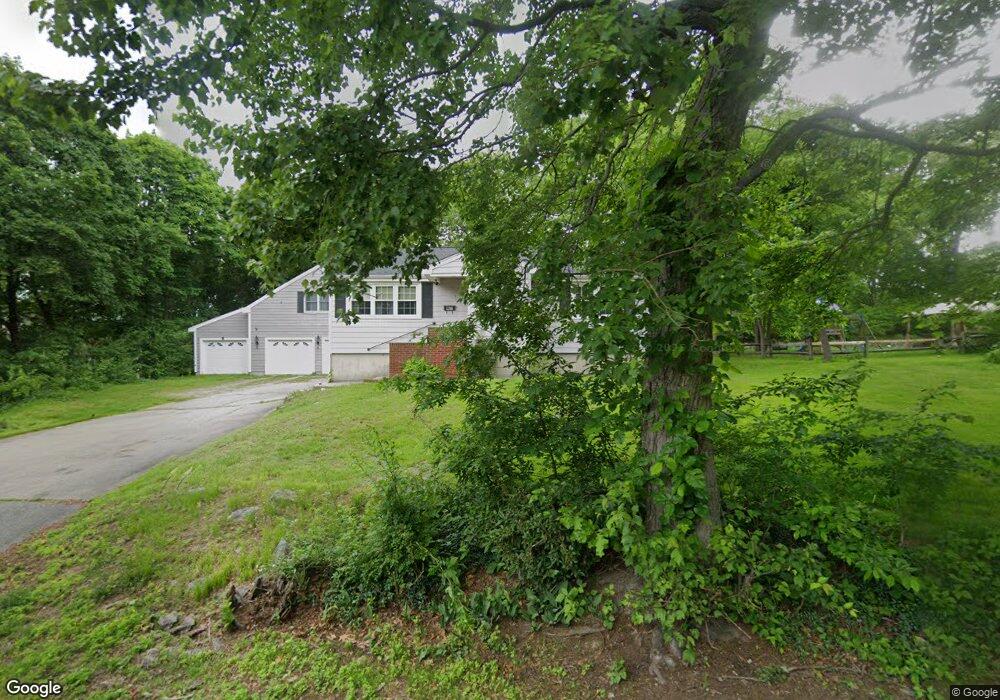
81 Leonard St Dedham, MA 02026
East Dedham NeighborhoodEstimated Value: $559,000 - $677,000
2
Beds
1
Bath
1,064
Sq Ft
$579/Sq Ft
Est. Value
About This Home
This home is located at 81 Leonard St, Dedham, MA 02026 and is currently estimated at $616,223, approximately $579 per square foot. 81 Leonard St is a home located in Norfolk County with nearby schools including Avery, Dedham Middle School, and Dedham High School.
Ownership History
Date
Name
Owned For
Owner Type
Purchase Details
Closed on
Sep 21, 2019
Sold by
Chase Edith C Est
Bought by
Benton J Gregory
Current Estimated Value
Home Financials for this Owner
Home Financials are based on the most recent Mortgage that was taken out on this home.
Original Mortgage
$324,900
Interest Rate
3.5%
Mortgage Type
New Conventional
Purchase Details
Closed on
Sep 20, 2019
Sold by
Chase Edith M Est
Bought by
Jacobsen Doyle Ret
Home Financials for this Owner
Home Financials are based on the most recent Mortgage that was taken out on this home.
Original Mortgage
$324,900
Interest Rate
3.5%
Mortgage Type
New Conventional
Create a Home Valuation Report for This Property
The Home Valuation Report is an in-depth analysis detailing your home's value as well as a comparison with similar homes in the area
Home Values in the Area
Average Home Value in this Area
Purchase History
| Date | Buyer | Sale Price | Title Company |
|---|---|---|---|
| Benton J Gregory | -- | -- | |
| Jacobsen Doyle Ret | -- | -- |
Source: Public Records
Mortgage History
| Date | Status | Borrower | Loan Amount |
|---|---|---|---|
| Previous Owner | Benton J Gregory | $324,900 |
Source: Public Records
Tax History Compared to Growth
Tax History
| Year | Tax Paid | Tax Assessment Tax Assessment Total Assessment is a certain percentage of the fair market value that is determined by local assessors to be the total taxable value of land and additions on the property. | Land | Improvement |
|---|---|---|---|---|
| 2025 | $6,950 | $550,700 | $286,600 | $264,100 |
| 2024 | $6,769 | $541,500 | $271,300 | $270,200 |
| 2023 | $6,369 | $496,000 | $240,900 | $255,100 |
| 2022 | $6,210 | $465,200 | $235,900 | $229,300 |
| 2021 | $6,115 | $447,300 | $230,800 | $216,500 |
| 2020 | $5,810 | $423,500 | $220,600 | $202,900 |
| 2019 | $5,581 | $394,400 | $191,900 | $202,500 |
| 2018 | $5,247 | $360,600 | $169,600 | $191,000 |
| 2017 | $5,165 | $349,900 | $158,900 | $191,000 |
| 2016 | $5,327 | $343,900 | $138,800 | $205,100 |
| 2015 | $5,150 | $324,500 | $135,700 | $188,800 |
| 2014 | $4,949 | $307,800 | $132,600 | $175,200 |
Source: Public Records
Map
Nearby Homes