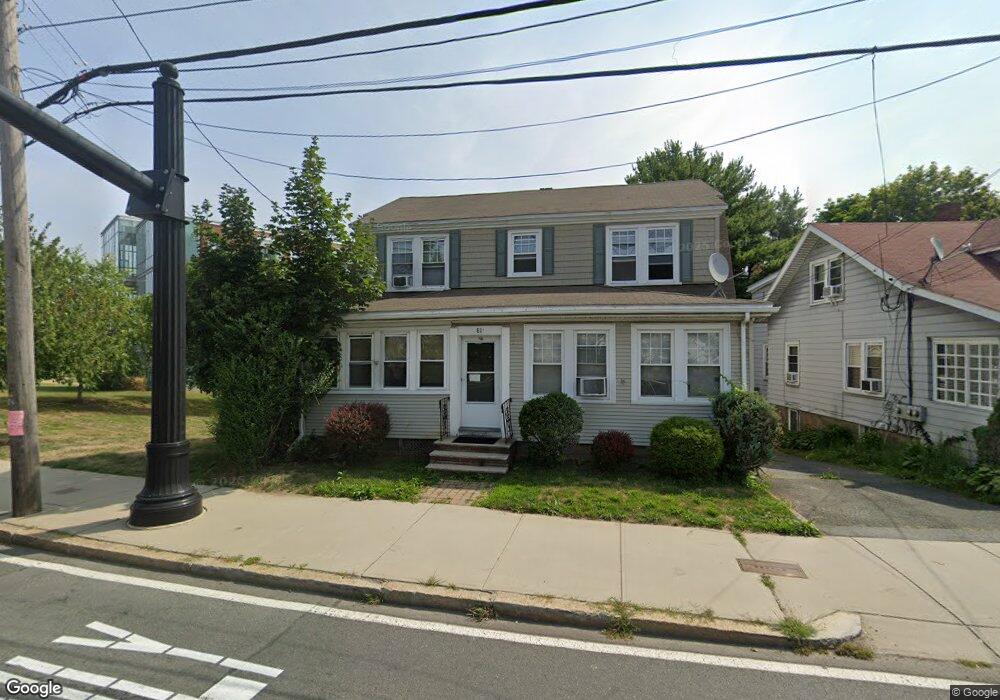
81 Loring Ave Salem, MA 01970
South Salem NeighborhoodEstimated Value: $687,000 - $787,000
4
Beds
2
Baths
2,188
Sq Ft
$332/Sq Ft
Est. Value
About This Home
This home is located at 81 Loring Ave, Salem, MA 01970 and is currently estimated at $727,310, approximately $332 per square foot. 81 Loring Ave is a home located in Essex County with nearby schools including Saltonstall School, Horace Mann Laboratory, and Witchcraft Heights Elementary School.
Ownership History
Date
Name
Owned For
Owner Type
Purchase Details
Closed on
Aug 18, 2015
Sold by
Nguyen Luong and Nguyen Phuong
Bought by
Salem 81 Loring Avenue
Current Estimated Value
Purchase Details
Closed on
Jul 31, 2015
Sold by
Maguire Marilyn G and Maguire Amy J
Bought by
Nguyen Luong and Nguyen Phuong
Purchase Details
Closed on
Mar 16, 2010
Sold by
Maguire Marilyn G and Maguire George E
Bought by
Bradbury George and Bradbury Jodi B
Create a Home Valuation Report for This Property
The Home Valuation Report is an in-depth analysis detailing your home's value as well as a comparison with similar homes in the area
Home Values in the Area
Average Home Value in this Area
Purchase History
| Date | Buyer | Sale Price | Title Company |
|---|---|---|---|
| Salem 81 Loring Avenue | -- | -- | |
| Nguyen Luong | $250,000 | -- | |
| Bradbury George | $360,000 | -- |
Source: Public Records
Mortgage History
| Date | Status | Borrower | Loan Amount |
|---|---|---|---|
| Previous Owner | Bradbury George | $71,000 | |
| Previous Owner | Bradbury George | $75,000 |
Source: Public Records
Tax History Compared to Growth
Tax History
| Year | Tax Paid | Tax Assessment Tax Assessment Total Assessment is a certain percentage of the fair market value that is determined by local assessors to be the total taxable value of land and additions on the property. | Land | Improvement |
|---|---|---|---|---|
| 2025 | $6,193 | $546,100 | $145,700 | $400,400 |
| 2024 | $5,994 | $515,800 | $145,700 | $370,100 |
| 2023 | $5,710 | $456,400 | $128,600 | $327,800 |
| 2022 | $5,789 | $436,900 | $120,000 | $316,900 |
| 2021 | $5,492 | $398,000 | $112,000 | $286,000 |
| 2020 | $5,557 | $384,600 | $128,200 | $256,400 |
| 2019 | $5,436 | $360,000 | $116,900 | $243,100 |
| 2018 | $4,889 | $317,900 | $101,100 | $216,800 |
| 2017 | $4,507 | $284,200 | $80,800 | $203,400 |
| 2016 | $5,069 | $323,500 | $77,000 | $246,500 |
| 2015 | $4,705 | $286,700 | $66,200 | $220,500 |
Source: Public Records
Map
Nearby Homes
- 11 Sumner Rd
- 10 Quadrant Rd
- 23 Marion Rd Unit B
- 2 Fletcher Way Unit 34D
- 24 Wisteria St Unit 2
- 263 Jefferson Ave
- 327 Lafayette St Unit 2
- 29 Willson St
- 10 Horton St
- 1 Laurent Rd Unit 3
- 17 Cliff St
- 4 Willow Ave Unit 2
- 10 Hazel St Unit 2
- 3 Cedarcrest Rd
- 2 Wilfred Terrace
- 59 Leach St Unit 2
- 9 Glover St Unit 1
- 83 Lafayette St
- 9 Lyme St
- 25 Calabrese St
- 81 Loring Ave Unit 1
- 75 Loring Ave
- 83 Loring Ave
- 83 Loring Ave Unit 1
- 83 Loring Ave Unit 2
- 87 Loring Ave
- 91 Loring Ave
- 185189 Loring Ave
- 92 Loring Ave
- 95 Loring Ave
- 72 Loring Ave
- 414 Jefferson Ave
- 101 Loring Ave
- 101 Loring Ave
- 412 Jefferson Ave
- 96 Loring Ave
- 408 Jefferson Ave
- 999 Jefferson Ave
- 103-105 Loring Ave Unit 1
- 103-105 Loring Ave Unit 2