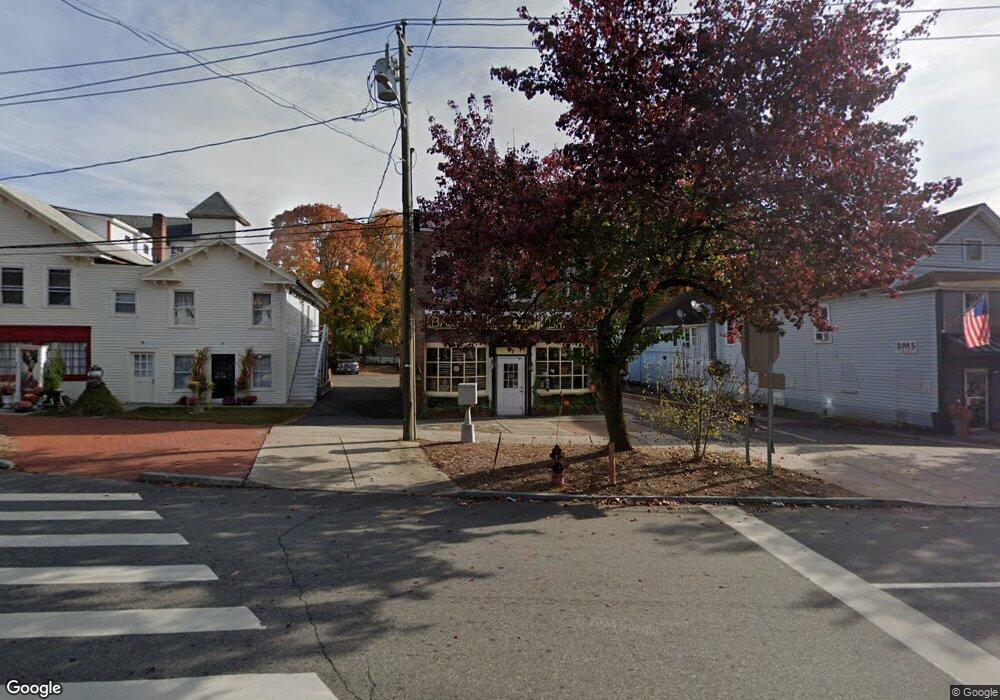
81 Main St Unit B East Hampton, CT 06424
Estimated Value: $372,418
--
Bed
--
Bath
2,208
Sq Ft
$169/Sq Ft
Est. Value
About This Home
This home is located at 81 Main St Unit B, East Hampton, CT 06424 and is currently estimated at $372,418, approximately $168 per square foot. 81 Main St Unit B is a home located in Middlesex County with nearby schools including Memorial School, Center Elementary School, and East Hampton Middle School.
Ownership History
Date
Name
Owned For
Owner Type
Purchase Details
Closed on
Apr 26, 2022
Sold by
Great Jake Llc
Bought by
T & O Enterprises Llc
Current Estimated Value
Purchase Details
Closed on
Apr 6, 2017
Sold by
Black Cat Music Llc
Bought by
Eisner Yvonne
Purchase Details
Closed on
Dec 29, 2015
Sold by
Eisner Yvonne
Bought by
Black Cat Music Llc
Purchase Details
Closed on
Aug 5, 2015
Sold by
Fdp Lp
Bought by
Eisner Yvonne
Home Financials for this Owner
Home Financials are based on the most recent Mortgage that was taken out on this home.
Original Mortgage
$169,400
Interest Rate
4.03%
Mortgage Type
Commercial
Purchase Details
Closed on
Oct 16, 1991
Sold by
Deriga Assoc
Bought by
Pierce Franklin D and Pierce Doreen H
Create a Home Valuation Report for This Property
The Home Valuation Report is an in-depth analysis detailing your home's value as well as a comparison with similar homes in the area
Home Values in the Area
Average Home Value in this Area
Purchase History
| Date | Buyer | Sale Price | Title Company |
|---|---|---|---|
| T & O Enterprises Llc | $290,000 | None Available | |
| T & O Enterprises Llc | $290,000 | None Available | |
| T & O Enterprises Llc | $290,000 | None Available | |
| Eisner Yvonne | -- | -- | |
| Fdp Lp | -- | -- | |
| Fdp Lp | -- | -- | |
| Eisner Yvonne | -- | -- | |
| Eisner Yvonne | -- | -- | |
| Black Cat Music Llc | -- | -- | |
| Black Cat Music Llc | -- | -- | |
| Black Cat Music Llc | -- | -- | |
| Eisner Yvonne | $186,000 | -- | |
| Eisner Yvonne | $186,000 | -- | |
| Eisner Yvonne | $186,000 | -- | |
| Pierce Franklin D | $134,545 | -- | |
| Pierce Franklin D | $134,545 | -- |
Source: Public Records
Mortgage History
| Date | Status | Borrower | Loan Amount |
|---|---|---|---|
| Previous Owner | Eisner Yvonne | $169,400 |
Source: Public Records
Tax History Compared to Growth
Tax History
| Year | Tax Paid | Tax Assessment Tax Assessment Total Assessment is a certain percentage of the fair market value that is determined by local assessors to be the total taxable value of land and additions on the property. | Land | Improvement |
|---|---|---|---|---|
| 2025 | $5,508 | $138,710 | $31,500 | $107,210 |
| 2024 | $5,277 | $138,710 | $31,500 | $107,210 |
| 2023 | $5,002 | $138,710 | $31,500 | $107,210 |
| 2022 | $4,808 | $138,710 | $31,500 | $107,210 |
| 2021 | $4,790 | $138,710 | $31,500 | $107,210 |
| 2020 | $4,403 | $132,850 | $31,500 | $101,350 |
| 2019 | $4,403 | $132,850 | $31,500 | $101,350 |
| 2018 | $4,296 | $137,160 | $31,500 | $105,660 |
| 2017 | $4,296 | $137,160 | $31,500 | $105,660 |
| 2016 | $4,038 | $137,160 | $31,500 | $105,660 |
| 2015 | $3,691 | $132,870 | $35,000 | $97,870 |
| 2014 | -- | $132,870 | $35,000 | $97,870 |
Source: Public Records
Map
Nearby Homes