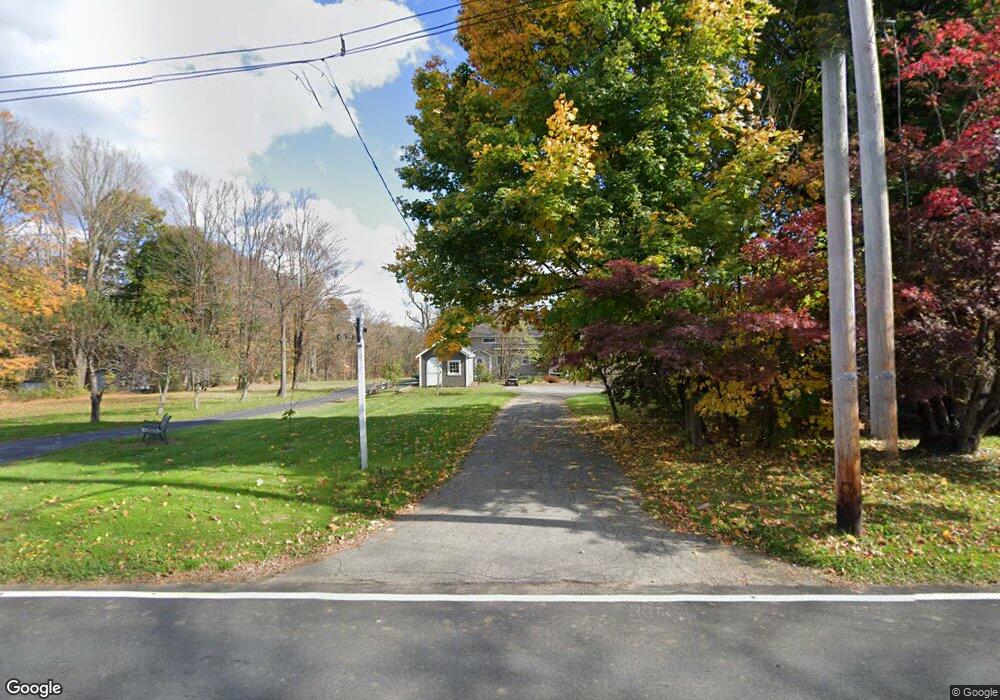
81 Main St Flanders, NJ 07836
Estimated Value: $443,084 - $573,000
Studio
--
Bath
1,890
Sq Ft
$262/Sq Ft
Est. Value
About This Home
This home is located at 81 Main St, Flanders, NJ 07836 and is currently estimated at $494,521, approximately $261 per square foot. 81 Main St is a home located in Morris County with nearby schools including Mt Olive Middle School, Mount Olive High School, and American Christian School.
Ownership History
Date
Name
Owned For
Owner Type
Purchase Details
Closed on
Feb 6, 2024
Sold by
Lojek Joseph and Lojek Connie
Bought by
Lojek Joseph and Lojek Connie
Current Estimated Value
Purchase Details
Closed on
Aug 29, 2003
Sold by
Jr
Bought by
Lojek Joe and Lojek Connie
Home Financials for this Owner
Home Financials are based on the most recent Mortgage that was taken out on this home.
Original Mortgage
$167,000
Interest Rate
6.35%
Create a Home Valuation Report for This Property
The Home Valuation Report is an in-depth analysis detailing your home's value as well as a comparison with similar homes in the area
Home Values in the Area
Average Home Value in this Area
Purchase History
| Date | Buyer | Sale Price | Title Company |
|---|---|---|---|
| Lojek Joseph | -- | None Listed On Document | |
| Lojek Joseph | -- | None Listed On Document | |
| Lojek Joe | $222,000 | -- |
Source: Public Records
Mortgage History
| Date | Status | Borrower | Loan Amount |
|---|---|---|---|
| Previous Owner | Lojek Joe | $167,000 |
Source: Public Records
Tax History
| Year | Tax Paid | Tax Assessment Tax Assessment Total Assessment is a certain percentage of the fair market value that is determined by local assessors to be the total taxable value of land and additions on the property. | Land | Improvement |
|---|---|---|---|---|
| 2025 | $9,326 | $227,700 | $105,200 | $122,500 |
| 2024 | $8,796 | $267,600 | $145,100 | $122,500 |
Source: Public Records
Map
Nearby Homes
- 95 Crenshaw Dr
- 15 Crossing Dr
- 11 Grover St
- 4 Virgil Ln
- 32 Gordon Way
- 1 Radcliffe Dr
- 56 Drake Way
- 9 Linwood Rd
- 10 Falcon Rd
- 150 U S Highway 206
- 4 Summit Ln
- 17 Pleasant Village Dr
- 4 Parkview Dr
- 3 Pilgrim Dr
- 225 Pleasant Hill Rd
- 14 Harwich Rd
- 4 Victoria Dr
- 80 Toby Dr
- 16 Devonshire Terrace
- 225 Emmans Rd
- 81 Main St Unit A
- 83 Main St Unit B
- 83 Main St
- 83 Main St Unit A
- 79 Main St
- 77 Main St
- 74 Main St
- 75 Main St
- 75 Main St Unit 7
- 75 Main St Unit 4
- 75 Main St Unit 3
- 75 Main St Unit 1
- 75 Main St Unit 2
- 75 Main St Unit 3
- 75 Main St Unit 1
- 75 Main St Unit 2
- 70 Main St
- 70 Main St
- 73 Main St
- 113 Crenshaw Dr
Your Personal Tour Guide
Ask me questions while you tour the home.