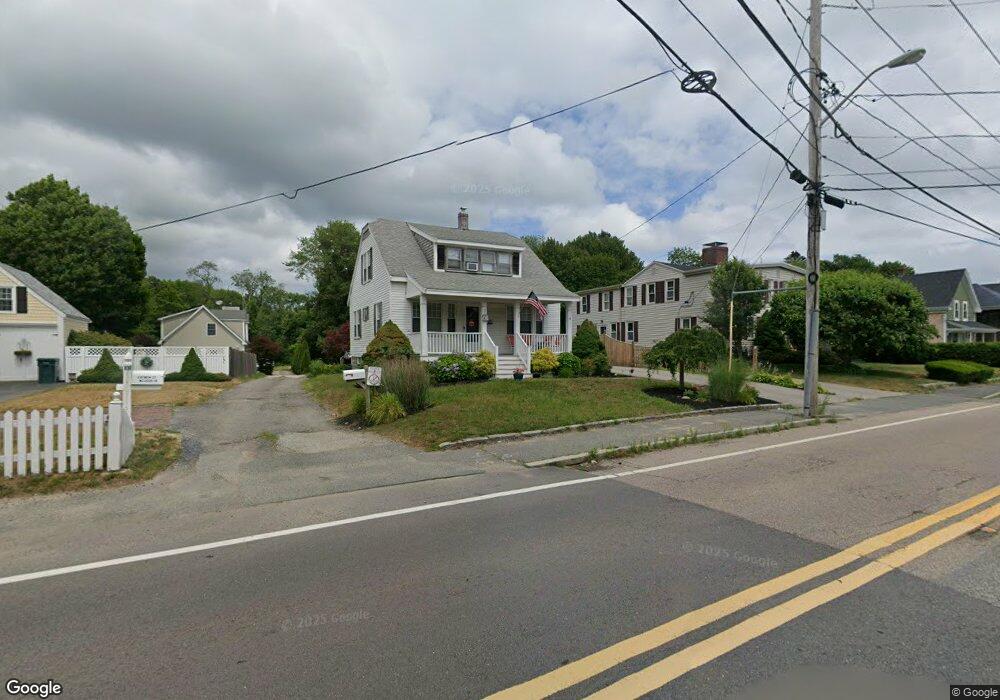
81 Main St Kingston, MA 02364
Estimated Value: $515,000 - $611,000
3
Beds
2
Baths
1,500
Sq Ft
$381/Sq Ft
Est. Value
About This Home
This home is located at 81 Main St, Kingston, MA 02364 and is currently estimated at $571,800, approximately $381 per square foot. 81 Main St is a home located in Plymouth County with nearby schools including Kingston Elementary School, Silver Lake Regional High School, and Kingston Intermediate School.
Ownership History
Date
Name
Owned For
Owner Type
Purchase Details
Closed on
Sep 25, 2025
Sold by
Bond Jennifer A
Bought by
Psb T T and Psb Bond
Current Estimated Value
Purchase Details
Closed on
Apr 19, 1996
Sold by
Ford Consumer Fin Co
Bought by
Bond Jeffrey S and Bond Jennifer A
Purchase Details
Closed on
Mar 10, 1995
Sold by
Randolph Roger J
Bought by
Ford Consumer Fin Co
Create a Home Valuation Report for This Property
The Home Valuation Report is an in-depth analysis detailing your home's value as well as a comparison with similar homes in the area
Home Values in the Area
Average Home Value in this Area
Purchase History
| Date | Buyer | Sale Price | Title Company |
|---|---|---|---|
| Psb T T | -- | -- | |
| Bond Jeffrey S | $91,000 | -- | |
| Ford Consumer Fin Co | $141,070 | -- |
Source: Public Records
Mortgage History
| Date | Status | Borrower | Loan Amount |
|---|---|---|---|
| Previous Owner | Ford Consumer Fin Co | $206,000 | |
| Previous Owner | Ford Consumer Fin Co | $50,000 | |
| Previous Owner | Ford Consumer Fin Co | $132,000 | |
| Previous Owner | Ford Consumer Fin Co | $20,000 |
Source: Public Records
Tax History
| Year | Tax Paid | Tax Assessment Tax Assessment Total Assessment is a certain percentage of the fair market value that is determined by local assessors to be the total taxable value of land and additions on the property. | Land | Improvement |
|---|---|---|---|---|
| 2025 | $6,309 | $486,400 | $192,200 | $294,200 |
| 2024 | $5,558 | $437,300 | $167,200 | $270,100 |
| 2023 | $5,128 | $383,800 | $167,200 | $216,600 |
| 2022 | $5,174 | $354,900 | $152,000 | $202,900 |
| 2021 | $4,917 | $305,800 | $140,200 | $165,600 |
| 2020 | $4,978 | $305,800 | $140,200 | $165,600 |
| 2019 | $4,561 | $277,100 | $140,200 | $136,900 |
| 2018 | $4,295 | $261,100 | $140,200 | $120,900 |
| 2017 | $4,203 | $254,700 | $136,100 | $118,600 |
| 2016 | $3,932 | $223,300 | $124,500 | $98,800 |
| 2015 | $3,806 | $224,700 | $124,500 | $100,200 |
| 2014 | $3,748 | $224,700 | $124,500 | $100,200 |
Source: Public Records
Map
Nearby Homes
- 94 Main St
- 17 Howlands Ln
- 12 Smiths Ln
- Lot 17-3 Howlands Ln
- 8 Blair Dr
- 6 Ropewalk Ct Unit 4
- 12 Curtis Ave
- 13 Atwood St
- 393 Court St Unit 3
- 393 Court St Unit 7
- 393 Court St Unit 5
- 5-7 Forest Ave
- 16 Copper Beech Dr Marion Dr
- 35 River St
- 4 S Spooner St Unit 6
- 4 S Spooner St Unit 7
- 4 S Spooner St Unit 8
- 2 S Spooner St Unit 2
- 2 S Spooner St Unit 3
- 2 S Spooner St Unit 4
Your Personal Tour Guide
Ask me questions while you tour the home.