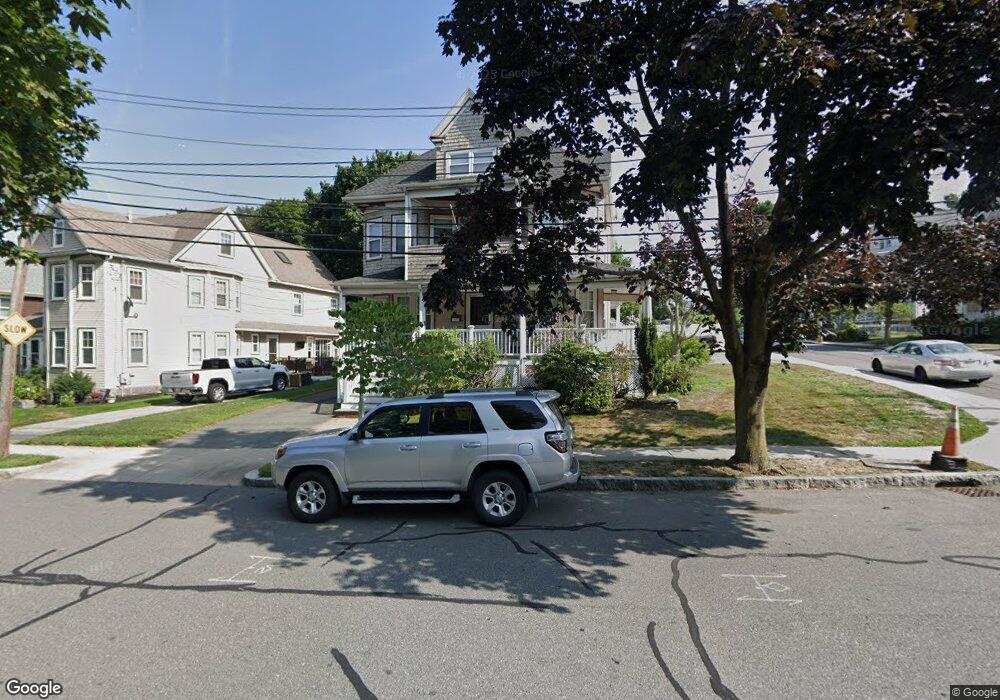
81 Merrymount Rd Quincy, MA 02169
Quincy Center NeighborhoodEstimated Value: $722,962 - $1,822,000
6
Beds
3
Baths
2,794
Sq Ft
$400/Sq Ft
Est. Value
About This Home
This home is located at 81 Merrymount Rd, Quincy, MA 02169 and is currently estimated at $1,118,491, approximately $400 per square foot. 81 Merrymount Rd is a home located in Norfolk County with nearby schools including Merrymount Elementary School, Central Middle School, and Quincy High School.
Ownership History
Date
Name
Owned For
Owner Type
Purchase Details
Closed on
Sep 1, 1995
Sold by
Deangelis Tr Frank
Bought by
Oshea Jeremiah M and Oshea Geraldine A
Current Estimated Value
Home Financials for this Owner
Home Financials are based on the most recent Mortgage that was taken out on this home.
Original Mortgage
$165,600
Interest Rate
7.61%
Mortgage Type
Purchase Money Mortgage
Create a Home Valuation Report for This Property
The Home Valuation Report is an in-depth analysis detailing your home's value as well as a comparison with similar homes in the area
Home Values in the Area
Average Home Value in this Area
Purchase History
| Date | Buyer | Sale Price | Title Company |
|---|---|---|---|
| Oshea Jeremiah M | $184,000 | -- |
Source: Public Records
Mortgage History
| Date | Status | Borrower | Loan Amount |
|---|---|---|---|
| Open | Oshea Jeremiah M | $162,000 | |
| Closed | Oshea Jeremiah M | $165,600 | |
| Previous Owner | Oshea Jeremiah M | $175,000 |
Source: Public Records
Tax History
| Year | Tax Paid | Tax Assessment Tax Assessment Total Assessment is a certain percentage of the fair market value that is determined by local assessors to be the total taxable value of land and additions on the property. | Land | Improvement |
|---|---|---|---|---|
| 2025 | $10,535 | $913,700 | $259,300 | $654,400 |
| 2024 | $9,542 | $846,700 | $233,300 | $613,400 |
| 2023 | $8,706 | $782,200 | $212,000 | $570,200 |
| 2022 | $8,677 | $724,300 | $192,800 | $531,500 |
| 2021 | $8,513 | $701,200 | $192,800 | $508,400 |
| 2020 | $8,348 | $671,600 | $172,800 | $498,800 |
| 2019 | $7,615 | $606,800 | $163,000 | $443,800 |
| 2018 | $7,856 | $588,900 | $173,200 | $415,700 |
| 2017 | $8,012 | $565,400 | $165,000 | $400,400 |
| 2016 | $7,408 | $515,900 | $164,500 | $351,400 |
| 2015 | $7,198 | $493,000 | $170,000 | $323,000 |
| 2014 | $6,391 | $430,100 | $158,400 | $271,700 |
Source: Public Records
Map
Nearby Homes
- 44 Armory St
- 1025 Hancock St Unit 11M
- 1025 Hancock St Unit 6J
- 28 Edgewood Cir
- 77 Adams St Unit 610
- 999 Hancock St Unit 402
- 20 Whitney Rd Unit 7
- 20 Whitney Rd Unit 1
- 20 Whitney Rd Unit 6
- 20 Whitney Rd Unit 2
- 915 Hancock St Unit 2
- 45 Oval Rd Unit 34
- 175 Qsd Unit B-23
- 105 Sea St Unit 105
- 105 Sea St Unit 102
- 72 Oakland Ave
- 59 Spear St Unit 302
- 59 Spear St Unit 402
- 59 Spear St Unit 202
- 59 Spear St Unit 301
- 81 Merrymount Rd Unit 1
- 81 Merrymount Rd Unit 2
- 87 Merrymount Rd
- 98 Putnam St
- 91 Putnam St
- 91 Merrymount Rd
- 89 Putnam St
- 89 Putnam St Unit 1
- 95 Putnam St
- 102 Putnam St
- 102 Putnam St
- 78 Putnam St
- 72 Merrymount Rd Unit 1 R
- 72 Merrymount Rd
- 101 Putnam St
- 86 Merrymount Rd
- 95 Merrymount Rd
- 104 Putnam St Unit 2
- 104 Putnam St
- 104 Putnam St
Your Personal Tour Guide
Ask me questions while you tour the home.