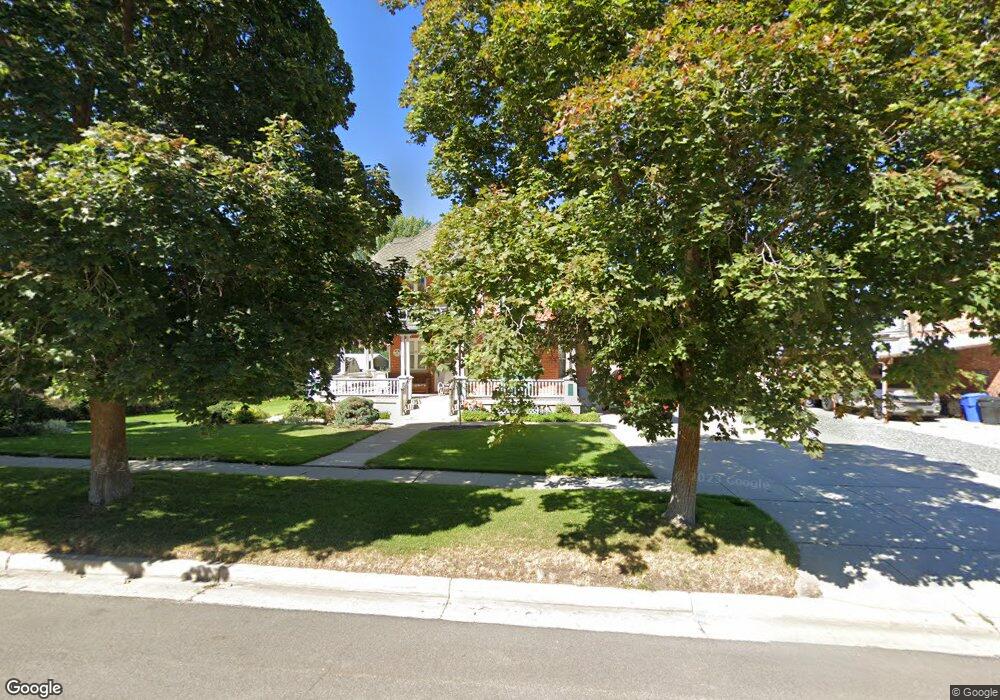
81 N 200 W Brigham City, UT 84302
Estimated Value: $241,652 - $324,000
Studio
--
Bath
600
Sq Ft
$485/Sq Ft
Est. Value
About This Home
This home is located at 81 N 200 W, Brigham City, UT 84302 and is currently estimated at $291,163, approximately $485 per square foot. 81 N 200 W is a home located in Box Elder County with nearby schools including Discovery School, Box Elder Middle School, and Adele C. Young Intermediate School.
Ownership History
Date
Name
Owned For
Owner Type
Purchase Details
Closed on
Dec 22, 2016
Sold by
Bywater Rodney E and Bywater Betty L
Bought by
38 East 600 North Llc
Current Estimated Value
Purchase Details
Closed on
Aug 7, 2007
Sold by
Bywater Rodney E and Bywater Betty L
Bought by
Bywater Rodney E and The Rodney E Bywater Inter Vivos Trust
Purchase Details
Closed on
May 23, 2007
Sold by
Bywater Rodney B
Bought by
Bywater Rodney E and Bywater Betty L
Create a Home Valuation Report for This Property
The Home Valuation Report is an in-depth analysis detailing your home's value as well as a comparison with similar homes in the area
Purchase History
| Date | Buyer | Sale Price | Title Company |
|---|---|---|---|
| 38 East 600 North Llc | -- | None Available | |
| Bywater Rodney E | -- | None Available | |
| Bywater Betty L | -- | None Available | |
| Bywater Rodney E | -- | None Available |
Source: Public Records
Tax History
| Year | Tax Paid | Tax Assessment Tax Assessment Total Assessment is a certain percentage of the fair market value that is determined by local assessors to be the total taxable value of land and additions on the property. | Land | Improvement |
|---|---|---|---|---|
| 2025 | $1,328 | $228,387 | $104,750 | $123,637 |
| 2024 | $1,156 | $222,579 | $99,750 | $122,829 |
| 2023 | $1,179 | $232,343 | $94,750 | $137,593 |
| 2022 | $1,074 | $196,760 | $40,000 | $156,760 |
| 2021 | $858 | $135,773 | $40,000 | $95,773 |
| 2020 | $836 | $135,773 | $40,000 | $95,773 |
| 2019 | $794 | $68,615 | $22,000 | $46,615 |
| 2018 | $728 | $62,535 | $22,000 | $40,535 |
| 2017 | $617 | $91,777 | $16,500 | $61,777 |
| 2016 | $448 | $33,701 | $16,500 | $17,201 |
| 2015 | $433 | $32,137 | $16,500 | $15,637 |
| 2014 | $433 | $14,892 | $0 | $14,892 |
| 2013 | -- | $31,392 | $16,500 | $14,892 |
Source: Public Records
Map
Nearby Homes
Your Personal Tour Guide
Ask me questions while you tour the home.