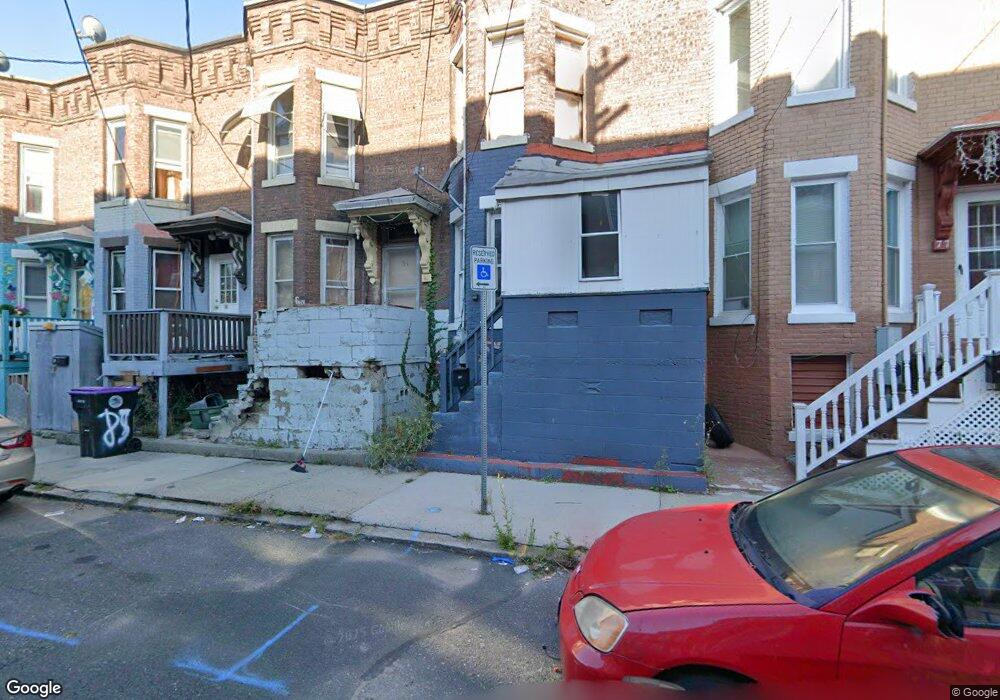
81 Newton St Holyoke, MA 01040
Estimated Value: $105,000 - $228,000
2
Beds
1
Bath
1,153
Sq Ft
$147/Sq Ft
Est. Value
About This Home
This home is located at 81 Newton St, Holyoke, MA 01040 and is currently estimated at $169,934, approximately $147 per square foot. 81 Newton St is a home located in Hampden County with nearby schools including H.B. Lawrence Elementary School, Holyoke High School, and Mater Dolorosa Elementary School.
Ownership History
Date
Name
Owned For
Owner Type
Purchase Details
Closed on
Feb 14, 2012
Sold by
Cote Andre
Bought by
Rivera Julio A
Current Estimated Value
Home Financials for this Owner
Home Financials are based on the most recent Mortgage that was taken out on this home.
Original Mortgage
$35,000
Outstanding Balance
$24,059
Interest Rate
3.96%
Mortgage Type
New Conventional
Estimated Equity
$145,875
Purchase Details
Closed on
Feb 1, 1994
Sold by
Cote Nil O and Cote Denise O
Bought by
Cote Andre
Create a Home Valuation Report for This Property
The Home Valuation Report is an in-depth analysis detailing your home's value as well as a comparison with similar homes in the area
Home Values in the Area
Average Home Value in this Area
Purchase History
| Date | Buyer | Sale Price | Title Company |
|---|---|---|---|
| Rivera Julio A | $35,000 | -- | |
| Cote Andre | $19,000 | -- |
Source: Public Records
Mortgage History
| Date | Status | Borrower | Loan Amount |
|---|---|---|---|
| Open | Cote Andre | $35,000 |
Source: Public Records
Tax History Compared to Growth
Tax History
| Year | Tax Paid | Tax Assessment Tax Assessment Total Assessment is a certain percentage of the fair market value that is determined by local assessors to be the total taxable value of land and additions on the property. | Land | Improvement |
|---|---|---|---|---|
| 2025 | $1,138 | $65,200 | $9,600 | $55,600 |
| 2024 | $1,042 | $55,000 | $9,200 | $45,800 |
| 2023 | $994 | $53,000 | $9,200 | $43,800 |
| 2022 | $842 | $43,700 | $9,200 | $34,500 |
| 2021 | $794 | $41,200 | $8,600 | $32,600 |
| 2020 | $700 | $36,700 | $8,600 | $28,100 |
| 2019 | $683 | $35,400 | $9,100 | $26,300 |
| 2018 | $650 | $34,000 | $9,100 | $24,900 |
| 2017 | $652 | $34,000 | $9,100 | $24,900 |
| 2016 | $654 | $34,200 | $8,600 | $25,600 |
| 2015 | $651 | $34,200 | $8,600 | $25,600 |
Source: Public Records
Map
Nearby Homes