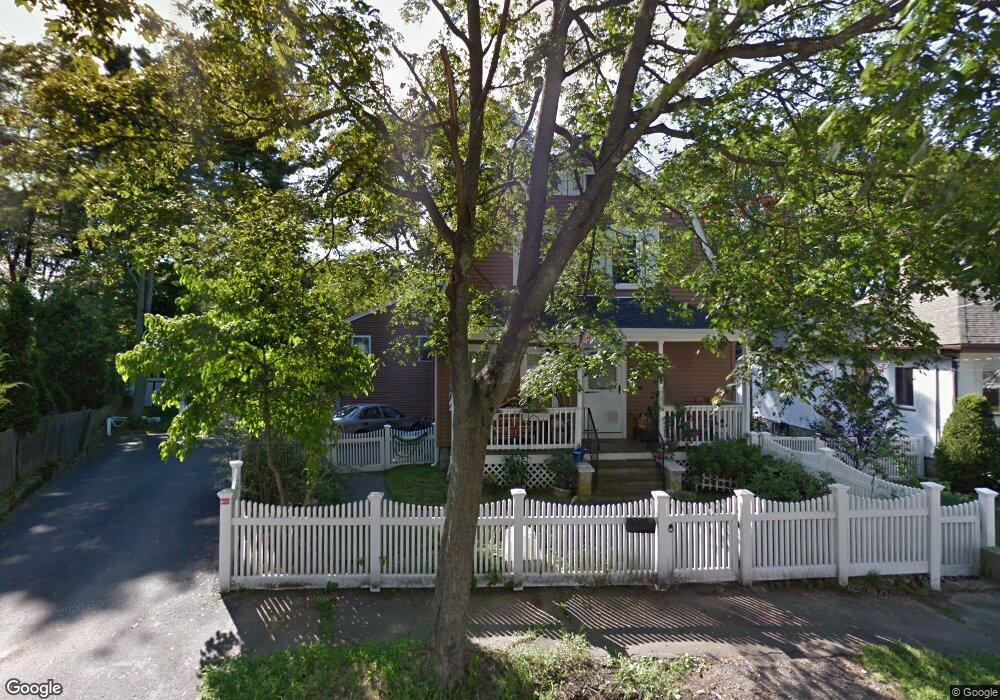
81 Oak St Dedham, MA 02026
East Dedham NeighborhoodEstimated Value: $752,168 - $827,000
4
Beds
2
Baths
2,074
Sq Ft
$380/Sq Ft
Est. Value
About This Home
This home is located at 81 Oak St, Dedham, MA 02026 and is currently estimated at $787,292, approximately $379 per square foot. 81 Oak St is a home located in Norfolk County with nearby schools including Avery, Dedham Middle School, and Dedham High School.
Ownership History
Date
Name
Owned For
Owner Type
Purchase Details
Closed on
Jun 5, 2013
Sold by
Macki Marel J and Macki Richard J
Bought by
Macki Marel J
Current Estimated Value
Home Financials for this Owner
Home Financials are based on the most recent Mortgage that was taken out on this home.
Original Mortgage
$180,000
Outstanding Balance
$127,699
Interest Rate
3.43%
Mortgage Type
New Conventional
Estimated Equity
$659,593
Create a Home Valuation Report for This Property
The Home Valuation Report is an in-depth analysis detailing your home's value as well as a comparison with similar homes in the area
Home Values in the Area
Average Home Value in this Area
Purchase History
| Date | Buyer | Sale Price | Title Company |
|---|---|---|---|
| Macki Marel J | -- | -- |
Source: Public Records
Mortgage History
| Date | Status | Borrower | Loan Amount |
|---|---|---|---|
| Open | Macki Marel J | $180,000 |
Source: Public Records
Tax History
| Year | Tax Paid | Tax Assessment Tax Assessment Total Assessment is a certain percentage of the fair market value that is determined by local assessors to be the total taxable value of land and additions on the property. | Land | Improvement |
|---|---|---|---|---|
| 2025 | $9,249 | $732,900 | $265,700 | $467,200 |
| 2024 | $9,156 | $732,500 | $251,600 | $480,900 |
| 2023 | $8,174 | $636,600 | $223,400 | $413,200 |
| 2022 | $7,716 | $578,000 | $218,700 | $359,300 |
| 2021 | $7,271 | $531,900 | $213,900 | $318,000 |
| 2020 | $7,169 | $522,500 | $204,500 | $318,000 |
| 2019 | $6,714 | $474,500 | $177,900 | $296,600 |
| 2018 | $6,619 | $454,900 | $158,300 | $296,600 |
| 2017 | $6,313 | $427,700 | $148,300 | $279,400 |
| 2016 | $6,438 | $415,600 | $129,500 | $286,100 |
| 2015 | $6,062 | $382,000 | $124,600 | $257,400 |
| 2014 | $6,109 | $379,900 | $121,800 | $258,100 |
Source: Public Records
Map
Nearby Homes
- 111 Schiller Rd
- 8 Sumner St
- 109 Rockland St
- 94 Rockland St
- 25 Rockland St Unit 5
- 25R Rockland St Unit 6
- 4 Mount Hope St
- 49 Greenhood St
- 153 Colburn St
- 42 Churchill Place
- 7 Pleasantdale Rd
- 231 Grove St
- 5170 Washington St Unit 107
- 231-245 Grove St
- 108 High St
- 132 Whitehall St
- 442 High St
- 28 Linden Place
- 90 High St Unit 309
- 56 Mount Vernon St
Your Personal Tour Guide
Ask me questions while you tour the home.