81 Oneil Rd West Warren, MA 01092
Estimated Value: $244,000 - $414,000
3
Beds
2
Baths
1,684
Sq Ft
$202/Sq Ft
Est. Value
About This Home
This home is located at 81 Oneil Rd, West Warren, MA 01092 and is currently estimated at $339,827, approximately $201 per square foot. 81 Oneil Rd is a home with nearby schools including Quaboag Regional High School.
Ownership History
Date
Name
Owned For
Owner Type
Purchase Details
Closed on
Feb 16, 2001
Sold by
Rj Fijol Inc
Bought by
Laprade Pierre F and Laprade Catherine A
Current Estimated Value
Home Financials for this Owner
Home Financials are based on the most recent Mortgage that was taken out on this home.
Original Mortgage
$124,830
Outstanding Balance
$45,090
Interest Rate
7.08%
Mortgage Type
Purchase Money Mortgage
Estimated Equity
$294,737
Create a Home Valuation Report for This Property
The Home Valuation Report is an in-depth analysis detailing your home's value as well as a comparison with similar homes in the area
Home Values in the Area
Average Home Value in this Area
Purchase History
| Date | Buyer | Sale Price | Title Company |
|---|---|---|---|
| Laprade Pierre F | $131,400 | -- |
Source: Public Records
Mortgage History
| Date | Status | Borrower | Loan Amount |
|---|---|---|---|
| Open | Laprade Pierre F | $124,830 |
Source: Public Records
Tax History Compared to Growth
Tax History
| Year | Tax Paid | Tax Assessment Tax Assessment Total Assessment is a certain percentage of the fair market value that is determined by local assessors to be the total taxable value of land and additions on the property. | Land | Improvement |
|---|---|---|---|---|
| 2025 | $3,846 | $259,700 | $40,300 | $219,400 |
| 2024 | $3,615 | $239,900 | $40,300 | $199,600 |
| 2023 | $3,790 | $239,900 | $40,300 | $199,600 |
| 2022 | $3,247 | $208,700 | $34,700 | $174,000 |
| 2021 | $0 | $198,900 | $32,800 | $166,100 |
| 2020 | $8,308 | $185,900 | $32,800 | $153,100 |
| 2019 | $3,182 | $175,300 | $32,800 | $142,500 |
| 2018 | $3,036 | $175,300 | $32,800 | $142,500 |
| 2017 | $2,964 | $159,700 | $34,100 | $125,600 |
| 2016 | $3,026 | $152,500 | $32,400 | $120,100 |
| 2015 | $2,713 | $144,700 | $32,400 | $112,300 |
| 2014 | $2,773 | $145,200 | $32,400 | $112,800 |
Source: Public Records
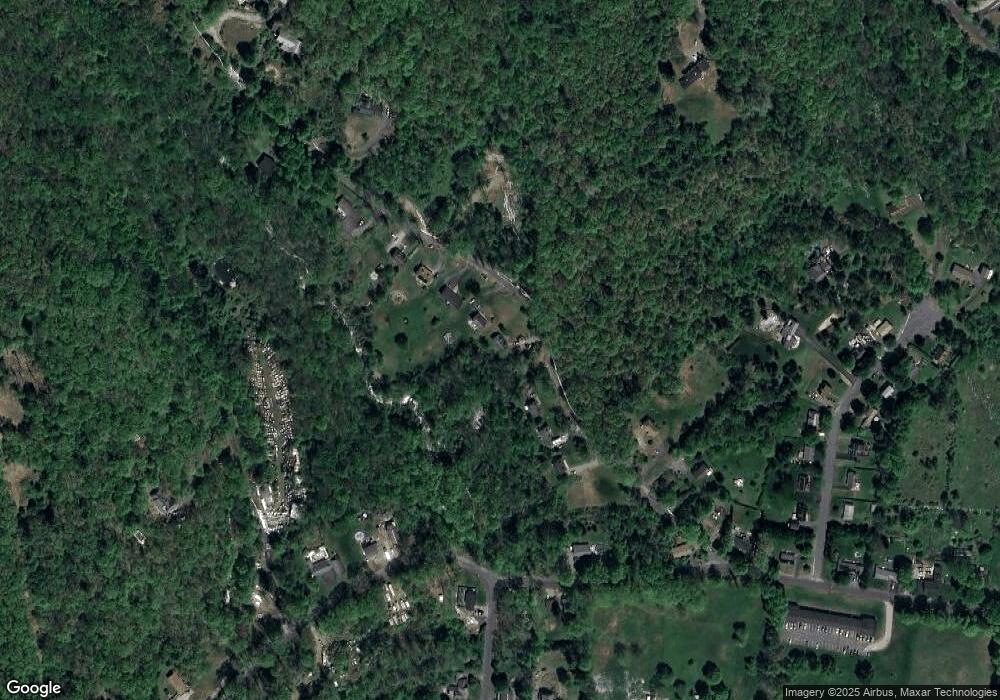
Map
Nearby Homes