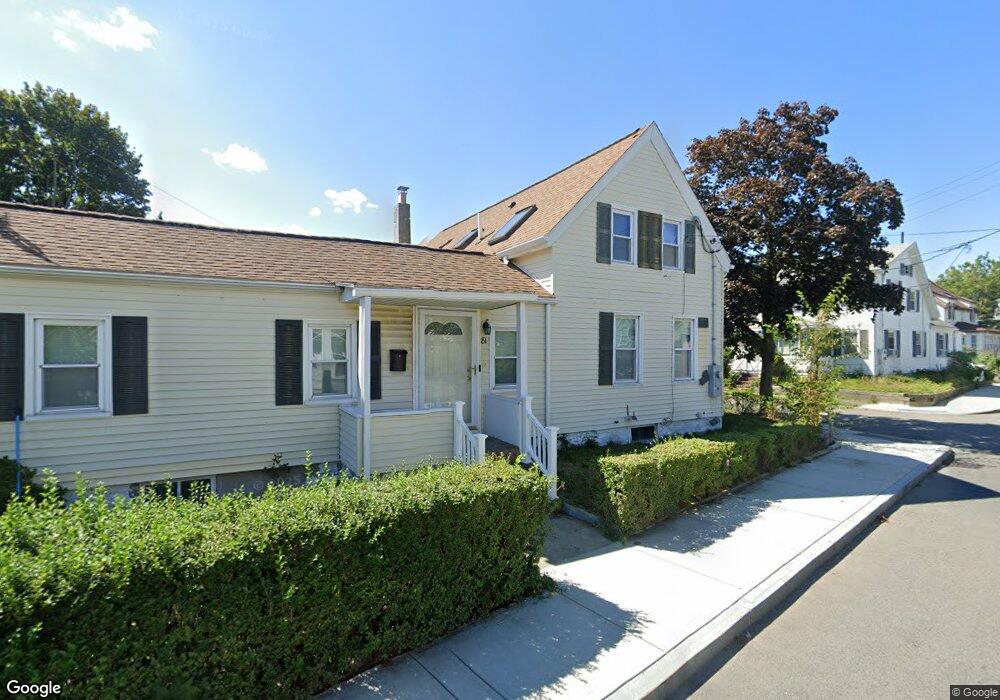
81 Phipps St Quincy, MA 02169
South Quincy NeighborhoodEstimated Value: $594,000 - $734,000
2
Beds
2
Baths
1,334
Sq Ft
$489/Sq Ft
Est. Value
About This Home
This home is located at 81 Phipps St, Quincy, MA 02169 and is currently estimated at $652,889, approximately $489 per square foot. 81 Phipps St is a home located in Norfolk County with nearby schools including Lincoln-Hancock Community School, South West Middle School, and Quincy High School.
Ownership History
Date
Name
Owned For
Owner Type
Purchase Details
Closed on
Jul 29, 2004
Sold by
Purpura Joseph J and Barrett Robert E
Bought by
Petkov Roumen T
Current Estimated Value
Home Financials for this Owner
Home Financials are based on the most recent Mortgage that was taken out on this home.
Original Mortgage
$228,650
Outstanding Balance
$115,860
Interest Rate
6.33%
Mortgage Type
Purchase Money Mortgage
Estimated Equity
$537,029
Create a Home Valuation Report for This Property
The Home Valuation Report is an in-depth analysis detailing your home's value as well as a comparison with similar homes in the area
Home Values in the Area
Average Home Value in this Area
Purchase History
| Date | Buyer | Sale Price | Title Company |
|---|---|---|---|
| Petkov Roumen T | $269,000 | -- |
Source: Public Records
Mortgage History
| Date | Status | Borrower | Loan Amount |
|---|---|---|---|
| Open | Petkov Roumen T | $228,650 |
Source: Public Records
Tax History Compared to Growth
Tax History
| Year | Tax Paid | Tax Assessment Tax Assessment Total Assessment is a certain percentage of the fair market value that is determined by local assessors to be the total taxable value of land and additions on the property. | Land | Improvement |
|---|---|---|---|---|
| 2025 | $6,580 | $570,700 | $295,900 | $274,800 |
| 2024 | $6,155 | $546,100 | $281,800 | $264,300 |
| 2023 | $5,637 | $506,500 | $256,200 | $250,300 |
| 2022 | $5,536 | $462,100 | $213,500 | $248,600 |
| 2021 | $5,214 | $429,500 | $213,500 | $216,000 |
| 2020 | $5,217 | $419,700 | $213,500 | $206,200 |
| 2019 | $5,085 | $405,200 | $201,400 | $203,800 |
| 2018 | $4,805 | $360,200 | $186,500 | $173,700 |
| 2017 | $4,794 | $338,300 | $177,600 | $160,700 |
| 2016 | $4,361 | $303,700 | $154,400 | $149,300 |
| 2015 | $4,244 | $290,700 | $154,400 | $136,300 |
| 2014 | $4,122 | $277,400 | $154,400 | $123,000 |
Source: Public Records
Map
Nearby Homes
- 126 Water St
- 50 N Payne St Unit 1
- 50 N Payne St Unit 3
- 50 N Payne St Unit 4
- 166 Phipps St
- 8 Jackson St Unit B4
- 155 Kendrick Ave Unit 502
- 33 Elm St
- 177 Franklin St
- 18 Cliveden St Unit 406W
- 2 Cliveden St Unit 601E
- 2 Cliveden St Unit 405E
- 2 Cliveden St Unit 505E
- 171-175 Granite St
- 24 South St Unit 203
- 35 Miller Stile Rd
- 94 Brook Rd Unit 3
- 118 Brook Rd Unit 2
- 100 Elm St
- 5 Main St