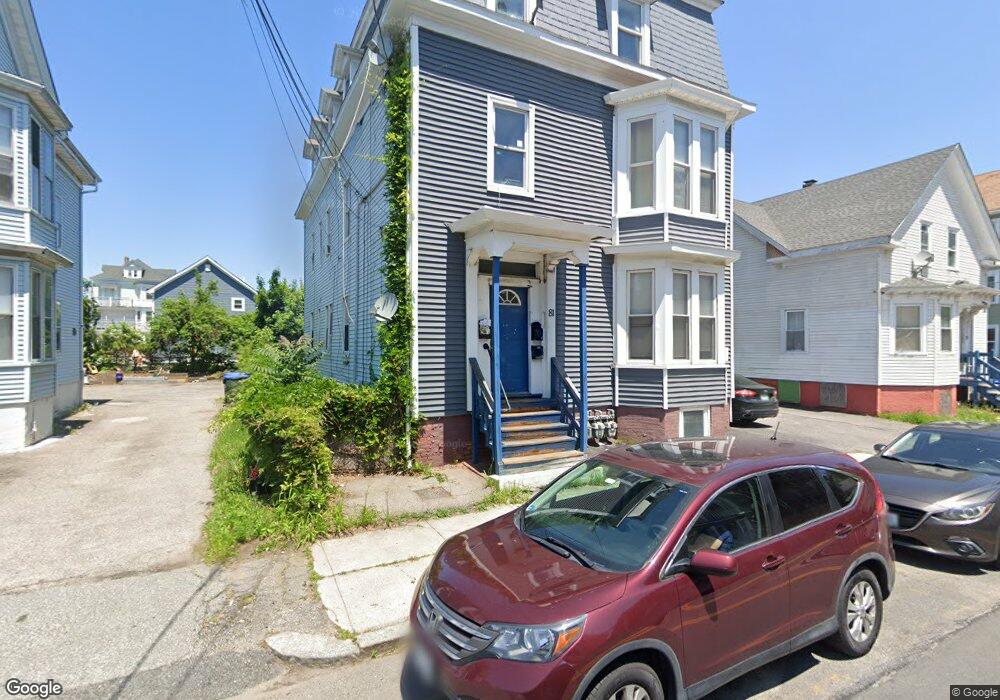
81 Potters Ave Providence, RI 02905
Lower South Providence NeighborhoodEstimated Value: $506,000 - $668,000
9
Beds
3
Baths
4,074
Sq Ft
$144/Sq Ft
Est. Value
About This Home
This home is located at 81 Potters Ave, Providence, RI 02905 and is currently estimated at $587,000, approximately $144 per square foot. 81 Potters Ave is a home located in Providence County with nearby schools including The Hope Academy, Bishop Mcvinney Elementary School, and Community Preparatory School.
Ownership History
Date
Name
Owned For
Owner Type
Purchase Details
Closed on
Jan 18, 2013
Sold by
Perez Evelyn
Bought by
Mejia Claribel
Current Estimated Value
Home Financials for this Owner
Home Financials are based on the most recent Mortgage that was taken out on this home.
Original Mortgage
$101,250
Interest Rate
3.39%
Mortgage Type
New Conventional
Purchase Details
Closed on
Oct 15, 2008
Sold by
Vargas Mynor E
Bought by
Accredited Home Lender
Purchase Details
Closed on
Sep 23, 2005
Sold by
Gregory Patrick
Bought by
Vargas Mynor E
Home Financials for this Owner
Home Financials are based on the most recent Mortgage that was taken out on this home.
Original Mortgage
$240,000
Interest Rate
5.92%
Mortgage Type
Purchase Money Mortgage
Purchase Details
Closed on
Jan 16, 1992
Sold by
Waldron Holwin
Bought by
Castillo Felix A
Create a Home Valuation Report for This Property
The Home Valuation Report is an in-depth analysis detailing your home's value as well as a comparison with similar homes in the area
Home Values in the Area
Average Home Value in this Area
Purchase History
| Date | Buyer | Sale Price | Title Company |
|---|---|---|---|
| Mejia Claribel | $135,000 | -- | |
| Accredited Home Lender | $87,900 | -- | |
| Vargas Mynor E | $300,000 | -- | |
| Castillo Felix A | $95,500 | -- |
Source: Public Records
Mortgage History
| Date | Status | Borrower | Loan Amount |
|---|---|---|---|
| Open | Castillo Felix A | $101,250 | |
| Closed | Mejia Claribel | $101,250 | |
| Previous Owner | Castillo Felix A | $240,000 | |
| Previous Owner | Castillo Felix A | $60,000 | |
| Previous Owner | Castillo Felix A | $227,500 |
Source: Public Records
Tax History
| Year | Tax Paid | Tax Assessment Tax Assessment Total Assessment is a certain percentage of the fair market value that is determined by local assessors to be the total taxable value of land and additions on the property. | Land | Improvement |
|---|---|---|---|---|
| 2025 | $8,746 | $624,700 | $121,500 | $503,200 |
| 2024 | $7,520 | $409,800 | $77,000 | $332,800 |
| 2023 | $7,520 | $409,800 | $77,000 | $332,800 |
| 2022 | $7,294 | $409,800 | $77,000 | $332,800 |
| 2021 | $5,256 | $214,000 | $35,400 | $178,600 |
| 2020 | $5,256 | $214,000 | $35,400 | $178,600 |
| 2019 | $5,256 | $214,000 | $35,400 | $178,600 |
| 2018 | $5,146 | $161,000 | $32,200 | $128,800 |
| 2017 | $5,146 | $161,000 | $32,200 | $128,800 |
| 2016 | $5,146 | $161,000 | $32,200 | $128,800 |
| 2015 | $4,359 | $131,700 | $32,200 | $99,500 |
| 2014 | $4,445 | $131,700 | $32,200 | $99,500 |
| 2013 | $4,445 | $131,700 | $32,200 | $99,500 |
Source: Public Records
Map
Nearby Homes
- 75 Potters Ave
- 85 Potters Ave
- 85 Potters Ave Unit 1
- 91 Potters Ave
- 4 Salisbury St
- 341 Plain St
- 69 Potters Ave
- 361 Fieldplain St
- 82 Potters Ave
- 80 Potters Ave Unit Third Floor
- 80 Potters Ave Unit 2
- 80 Potters Ave Unit 3
- 74 Potters Ave
- 10 Salisbury St
- 78 Potters Ave
- 78 Potters Ave Unit 1
- 78 Potters Ave
- 78 Potters Ave Unit Fl 1
- 78 Potters Ave Unit Basement
- 78 Potters Ave Unit Basement Room02
Your Personal Tour Guide
Ask me questions while you tour the home.