
Seller's Agent in 2017
Matt Kelly
Keller Williams Elite
(508) 294-3869
6 in this area
89 Total Sales
Estimated Value: $451,225 - $500,000
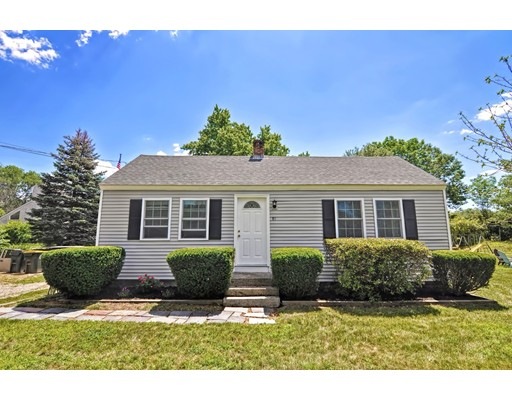
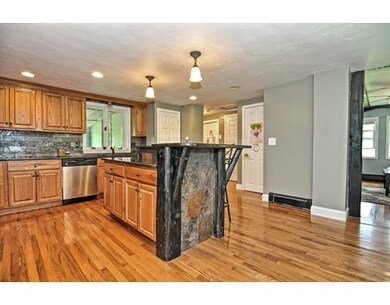
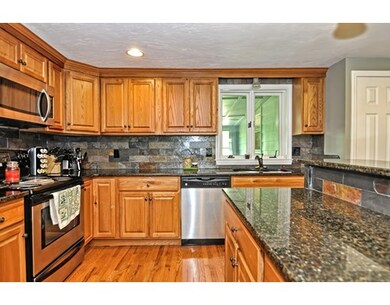
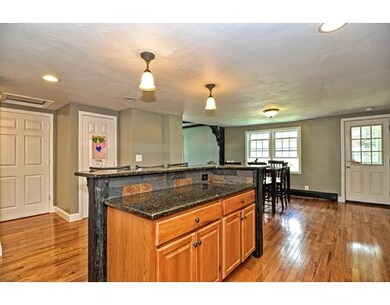
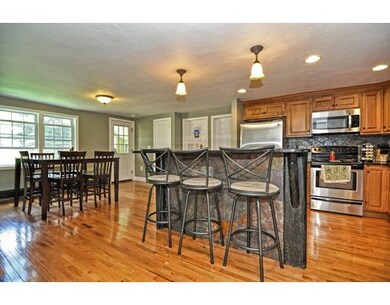
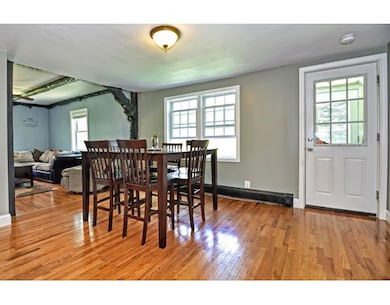
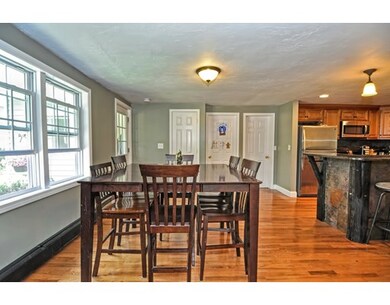
Great 3 bedroom ranch. Home features large updated eat in kitchen with granite countertops and lots of cabinets. Living room with hardwood flooring, updated bath. Tiled mud room, New roof. Large back yard. Passing Title V. Dont miss out on this one!!!
| Date | Buyer | Sale Price | Title Company |
|---|---|---|---|
| Reilly Real Estate Llc | $59,426 | -- | |
| Department Of Housing & Urban Dev | -- | -- | |
| Metlife Bank Na | $336,362 | -- | |
| Burr Michael E | $130,000 | -- |
| Date | Status | Borrower | Loan Amount |
|---|---|---|---|
| Open | Reilly Real Estate Llc | $126,000 | |
| Previous Owner | Burr Michael E | $124,000 |
| Date | Event | Price | List to Sale | Price per Sq Ft | Prior Sale |
|---|---|---|---|---|---|
| 10/04/2017 10/04/17 | Sold | $282,500 | -2.6% | $234 / Sq Ft | |
| 09/11/2017 09/11/17 | Pending | -- | -- | -- | |
| 08/25/2017 08/25/17 | For Sale | $289,900 | 0.0% | $240 / Sq Ft | |
| 08/15/2017 08/15/17 | Pending | -- | -- | -- | |
| 08/04/2017 08/04/17 | For Sale | $289,900 | +42.1% | $240 / Sq Ft | |
| 04/11/2014 04/11/14 | Sold | $204,000 | -6.8% | $169 / Sq Ft | View Prior Sale |
| 03/20/2014 03/20/14 | Pending | -- | -- | -- | |
| 02/08/2014 02/08/14 | For Sale | $219,000 | +7.4% | $181 / Sq Ft | |
| 02/06/2014 02/06/14 | Off Market | $204,000 | -- | -- | |
| 12/12/2013 12/12/13 | Price Changed | $219,000 | -0.4% | $181 / Sq Ft | |
| 11/21/2013 11/21/13 | Price Changed | $219,900 | 0.0% | $182 / Sq Ft | |
| 10/18/2013 10/18/13 | For Sale | $219,990 | +7.8% | $182 / Sq Ft | |
| 08/22/2013 08/22/13 | Off Market | $204,000 | -- | -- | |
| 08/15/2013 08/15/13 | For Sale | $219,990 | +7.8% | $182 / Sq Ft | |
| 08/08/2013 08/08/13 | Off Market | $204,000 | -- | -- | |
| 08/06/2013 08/06/13 | For Sale | $219,990 | +270.2% | $182 / Sq Ft | |
| 11/14/2012 11/14/12 | Sold | $59,426 | -41.8% | $49 / Sq Ft | View Prior Sale |
| 10/04/2012 10/04/12 | Pending | -- | -- | -- | |
| 09/20/2012 09/20/12 | For Sale | $102,060 | 0.0% | $84 / Sq Ft | |
| 09/13/2012 09/13/12 | Pending | -- | -- | -- | |
| 08/29/2012 08/29/12 | For Sale | $102,060 | 0.0% | $84 / Sq Ft | |
| 08/23/2012 08/23/12 | Pending | -- | -- | -- | |
| 08/21/2012 08/21/12 | Price Changed | $102,060 | 0.0% | $84 / Sq Ft | |
| 08/21/2012 08/21/12 | For Sale | $102,060 | -10.0% | $84 / Sq Ft | |
| 08/14/2012 08/14/12 | Pending | -- | -- | -- | |
| 08/03/2012 08/03/12 | For Sale | $113,400 | 0.0% | $94 / Sq Ft | |
| 07/12/2012 07/12/12 | Pending | -- | -- | -- | |
| 07/07/2012 07/07/12 | Price Changed | $113,400 | -10.0% | $94 / Sq Ft | |
| 06/01/2012 06/01/12 | Price Changed | $126,000 | -10.0% | $104 / Sq Ft | |
| 04/16/2012 04/16/12 | For Sale | $140,000 | -- | $116 / Sq Ft |
| Year | Tax Paid | Tax Assessment Tax Assessment Total Assessment is a certain percentage of the fair market value that is determined by local assessors to be the total taxable value of land and additions on the property. | Land | Improvement |
|---|---|---|---|---|
| 2025 | $5,001 | $398,200 | $133,700 | $264,500 |
| 2024 | $4,808 | $373,900 | $122,100 | $251,800 |
| 2023 | $4,633 | $355,000 | $116,200 | $238,800 |
| 2022 | $4,558 | $323,700 | $96,900 | $226,800 |
| 2021 | $4,396 | $305,100 | $96,900 | $208,200 |
| 2020 | $4,124 | $290,000 | $96,900 | $193,100 |
| 2019 | $4,009 | $282,100 | $96,900 | $185,200 |
| 2018 | $3,804 | $264,000 | $97,800 | $166,200 |
| 2017 | $3,684 | $256,900 | $97,800 | $159,100 |
| 2016 | $3,575 | $250,200 | $101,700 | $148,500 |
| 2015 | $3,429 | $240,600 | $97,800 | $142,800 |
| 2014 | $3,411 | $232,700 | $94,400 | $138,300 |
Seller's Agent in 2017
Matt Kelly
Keller Williams Elite
(508) 294-3869
6 in this area
89 Total Sales
Buyer's Agent in 2017
Richard Casavant
Casavant Realty Inc
(774) 217-3096
1 in this area
13 Total Sales
Seller's Agent in 2014
Shawn Costa
Compass
(508) 364-7453
65 Total Sales
L
Buyer's Agent in 2014
Linda Konvalinka
Berkshire Hathaway HomeServices Page Realty
M
Seller's Agent in 2012
Maureen Hunte
The Hunte Group REALTORS®
(617) 694-9760
4 Total Sales
S
Buyer's Agent in 2012
Shaun Reilly
AA Premier Properties, LLC
Source: MLS Property Information Network (MLS PIN)
MLS Number: 72208744
APN: BELL-000080-000011
Disclaimer: Certain information contained herein is derived from information provided by parties other than Homes.com. All information provided is deemed reliable, but is not guaranteed to be accurate and should be independently verified.
![]() The property listing data and information, or the Images, set forth herein were provided to MLS Property Information Network, Inc. from third party sources, including sellers, lessors and public records, and were compiled by MLS Property Information Network, Inc. The property listing data and information, and the Images, are for the personal, non-commercial use of consumers having a good faith interest in purchasing or leasing listed properties of the type displayed to them and may not be used for any purpose other than to identify prospective properties which such consumers may have a good faith interest in purchasing or leasing. MLS Property Information Network, Inc. and its subscribers disclaim any and all representations and warranties as to the accuracy of the property listing data and information, or as to the accuracy of any of the Images, set forth herein.
The property listing data and information, or the Images, set forth herein were provided to MLS Property Information Network, Inc. from third party sources, including sellers, lessors and public records, and were compiled by MLS Property Information Network, Inc. The property listing data and information, and the Images, are for the personal, non-commercial use of consumers having a good faith interest in purchasing or leasing listed properties of the type displayed to them and may not be used for any purpose other than to identify prospective properties which such consumers may have a good faith interest in purchasing or leasing. MLS Property Information Network, Inc. and its subscribers disclaim any and all representations and warranties as to the accuracy of the property listing data and information, or as to the accuracy of any of the Images, set forth herein.