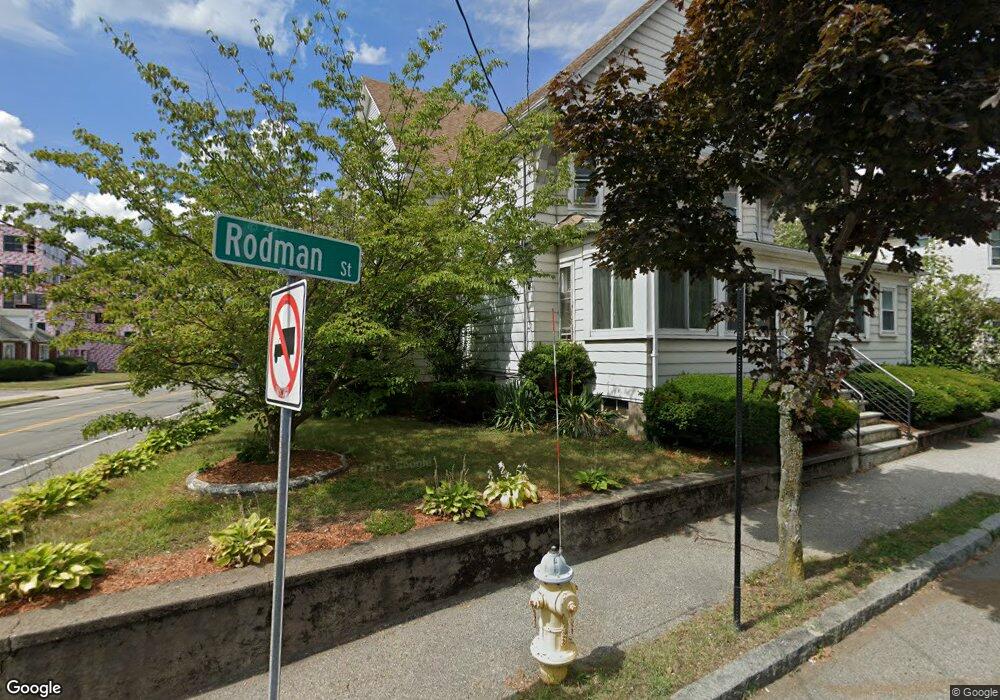
81 Rodman St Quincy, MA 02169
South Quincy NeighborhoodEstimated Value: $875,000 - $1,198,000
8
Beds
4
Baths
3,486
Sq Ft
$294/Sq Ft
Est. Value
About This Home
This home is located at 81 Rodman St, Quincy, MA 02169 and is currently estimated at $1,025,267, approximately $294 per square foot. 81 Rodman St is a home located in Norfolk County with nearby schools including South West Middle School, Lincoln-Hancock Community School, and Quincy High School.
Ownership History
Date
Name
Owned For
Owner Type
Purchase Details
Closed on
Dec 30, 1999
Sold by
Cedrone Ft
Bought by
Batista Venancia M and Batista Ignacio C
Current Estimated Value
Home Financials for this Owner
Home Financials are based on the most recent Mortgage that was taken out on this home.
Original Mortgage
$216,000
Interest Rate
7.71%
Mortgage Type
Purchase Money Mortgage
Create a Home Valuation Report for This Property
The Home Valuation Report is an in-depth analysis detailing your home's value as well as a comparison with similar homes in the area
Home Values in the Area
Average Home Value in this Area
Purchase History
| Date | Buyer | Sale Price | Title Company |
|---|---|---|---|
| Batista Venancia M | $240,000 | -- |
Source: Public Records
Mortgage History
| Date | Status | Borrower | Loan Amount |
|---|---|---|---|
| Open | Batista Venancia M | $270,000 | |
| Closed | Batista Venancia M | $216,000 |
Source: Public Records
Tax History Compared to Growth
Tax History
| Year | Tax Paid | Tax Assessment Tax Assessment Total Assessment is a certain percentage of the fair market value that is determined by local assessors to be the total taxable value of land and additions on the property. | Land | Improvement |
|---|---|---|---|---|
| 2025 | $10,799 | $936,600 | $295,600 | $641,000 |
| 2024 | $10,138 | $899,600 | $281,500 | $618,100 |
| 2023 | $9,728 | $874,000 | $255,900 | $618,100 |
| 2022 | $9,959 | $831,300 | $213,300 | $618,000 |
| 2021 | $9,095 | $749,200 | $213,300 | $535,900 |
| 2020 | $9,316 | $749,500 | $213,300 | $536,200 |
| 2019 | $8,702 | $693,400 | $201,200 | $492,200 |
| 2018 | $6,970 | $522,500 | $186,300 | $336,200 |
| 2017 | $6,466 | $456,300 | $177,400 | $278,900 |
| 2016 | $5,710 | $397,600 | $154,300 | $243,300 |
| 2015 | $5,777 | $395,700 | $154,300 | $241,400 |
| 2014 | $5,174 | $348,200 | $154,300 | $193,900 |
Source: Public Records
Map
Nearby Homes
- 21 Totman St Unit 202
- 21 Totman St Unit 309
- 21 Totman St Unit Model-1
- 21 Totman St Unit 209
- 21 Totman St Unit 203
- 21 Totman St Unit 2
- 347 Centre St
- 56 Penn St Unit 4
- 118 Brook Rd Unit 2
- 94 Brook Rd Unit 3
- 72 Federal Ave
- 192 Federal Ave Unit B
- 64 Garfield St Unit B
- 51 Brook Rd
- 91 Garfield St
- 177 Franklin St
- 8 Jackson St Unit B2
- 21 Arthur St
- 9 Independence Ave Unit 307
- 12 Arthur Ave
- 75 Rodman St
- 75 Rodman St Unit 1
- 75 Rodman St Unit 2
- 80 Rodman St
- 80 Rodman St Unit 2
- 288 Centre St
- 71 Rodman St
- 76 Rodman St
- 291 Centre St
- 72 Rodman St
- 122 Intervale St
- 65 Rodman St
- 68 Rodman St
- 68 Rodman St Unit 68
- 70 Rodman St
- 70 Rodman St Unit 2
- 89 Trafford St
- 316 Centre St
- 278 Centre St Unit 2
- 278 Centre St