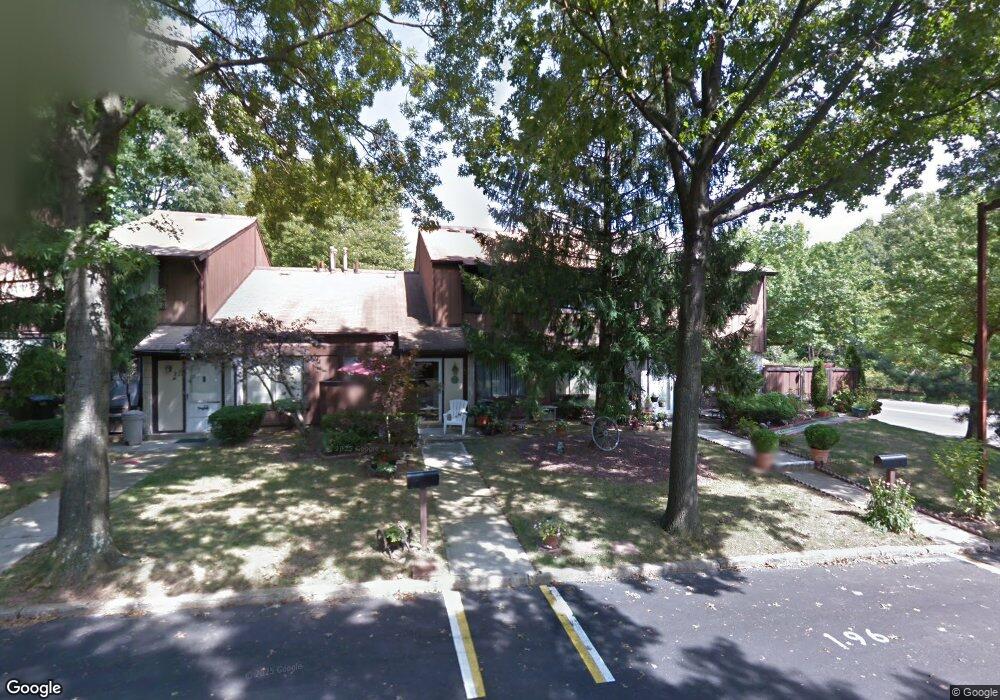
81 Rumson Rd Unit 28D Staten Island, NY 10314
New Springville NeighborhoodEstimated Value: $404,000 - $431,079
1
Bed
2
Baths
1,104
Sq Ft
$381/Sq Ft
Est. Value
About This Home
This home is located at 81 Rumson Rd Unit 28D, Staten Island, NY 10314 and is currently estimated at $421,020, approximately $381 per square foot. 81 Rumson Rd Unit 28D is a home located in Richmond County with nearby schools including P.S. 58R Space Shuttle Columbia School, Is 72 Rocco Laurie, and Port Richmond High School.
Ownership History
Date
Name
Owned For
Owner Type
Purchase Details
Closed on
Feb 18, 2014
Sold by
Bunnicelli Lorraine A
Bought by
Bunnicelli Lorraine A and The Lorraine Bunnicelli Family
Current Estimated Value
Purchase Details
Closed on
Mar 25, 2002
Sold by
Stanton Gayle
Bought by
Bunnicelli Lorraine A
Home Financials for this Owner
Home Financials are based on the most recent Mortgage that was taken out on this home.
Original Mortgage
$77,500
Interest Rate
7.18%
Purchase Details
Closed on
Feb 13, 1998
Sold by
Shea Louise
Bought by
Stanton Gayle
Home Financials for this Owner
Home Financials are based on the most recent Mortgage that was taken out on this home.
Original Mortgage
$61,200
Interest Rate
6.93%
Create a Home Valuation Report for This Property
The Home Valuation Report is an in-depth analysis detailing your home's value as well as a comparison with similar homes in the area
Home Values in the Area
Average Home Value in this Area
Purchase History
| Date | Buyer | Sale Price | Title Company |
|---|---|---|---|
| Bunnicelli Lorraine A | -- | First American Title Ins Co | |
| Bunnicelli Lorraine A | $137,500 | Commonwealth Land Title Ins | |
| Stanton Gayle | $68,000 | First American Title Ins Co |
Source: Public Records
Mortgage History
| Date | Status | Borrower | Loan Amount |
|---|---|---|---|
| Previous Owner | Bunnicelli Lorraine A | $77,500 | |
| Previous Owner | Stanton Gayle | $61,200 |
Source: Public Records
Tax History Compared to Growth
Tax History
| Year | Tax Paid | Tax Assessment Tax Assessment Total Assessment is a certain percentage of the fair market value that is determined by local assessors to be the total taxable value of land and additions on the property. | Land | Improvement |
|---|---|---|---|---|
| 2025 | $1,967 | $22,273 | $930 | $21,343 |
| 2024 | $2,071 | $21,715 | $947 | $20,768 |
| 2023 | $1,945 | $12,822 | $862 | $11,960 |
| 2022 | $1,756 | $17,874 | $1,513 | $16,361 |
| 2021 | $1,691 | $17,874 | $1,513 | $16,361 |
| 2020 | $2,120 | $17,930 | $1,513 | $16,417 |
| 2019 | $2,076 | $17,793 | $1,513 | $16,280 |
| 2018 | $1,881 | $10,685 | $942 | $9,743 |
| 2017 | $1,755 | $10,081 | $817 | $9,264 |
| 2016 | $1,591 | $9,511 | $794 | $8,717 |
| 2015 | $1,506 | $9,511 | $790 | $8,721 |
| 2014 | $1,506 | $9,439 | $928 | $8,511 |
Source: Public Records
Map
Nearby Homes
- 51 Rumson Rd
- 5 Windham Loop Unit 3K
- 11 Windham Loop Unit 2CC
- 11 Windham Loop Unit 2DD
- 11 Windham Loop Unit 3II
- 5 Windham Loop Unit 1E
- 463 Windham Loop
- 61 Stone Ln Unit 137
- 458 Windham Loop Unit O
- 89 Lott Ln
- 171 Wellington Ct Unit 3B
- 11 Kathy Place Unit 3B
- 85 Elmwood Park Dr Unit 2
- 160 Devon Loop Unit 5
- 50 Donna Ct Unit 5
- 30 Donna Ct Unit 6
- 120 Devon Loop Unit 6
- 54 Pierpont Place Unit C
- 2 Elmwood Park Dr Unit 404
- 2 Elmwood Park Dr Unit 610
- 67 Rumson Rd
- 83 Rumson Rd Unit 29C
- 79 Rumson Rd
- 65 Rumson Rd
- 69 Rumson Rd Unit 32D
- 77 Rumson Rd
- 71 Rumson Rd Unit 33D
- 75 Rumson Rd
- 73 Rumson Rd Unit 34C
- 59 Rumson Rd
- 61 Rumson Rd
- 63 Rumson Rd
- 70 Rumson Rd Unit 2E
- 68 Rumson Rd Unit 3E
- 66 Rumson Rd Unit 4E
- 72 Rumson Rd
- 43 Rumson Rd Unit 42F
- 64 Rumson Rd Unit 1/5E
- 41 Rumson Rd
- 62 Rumson Rd