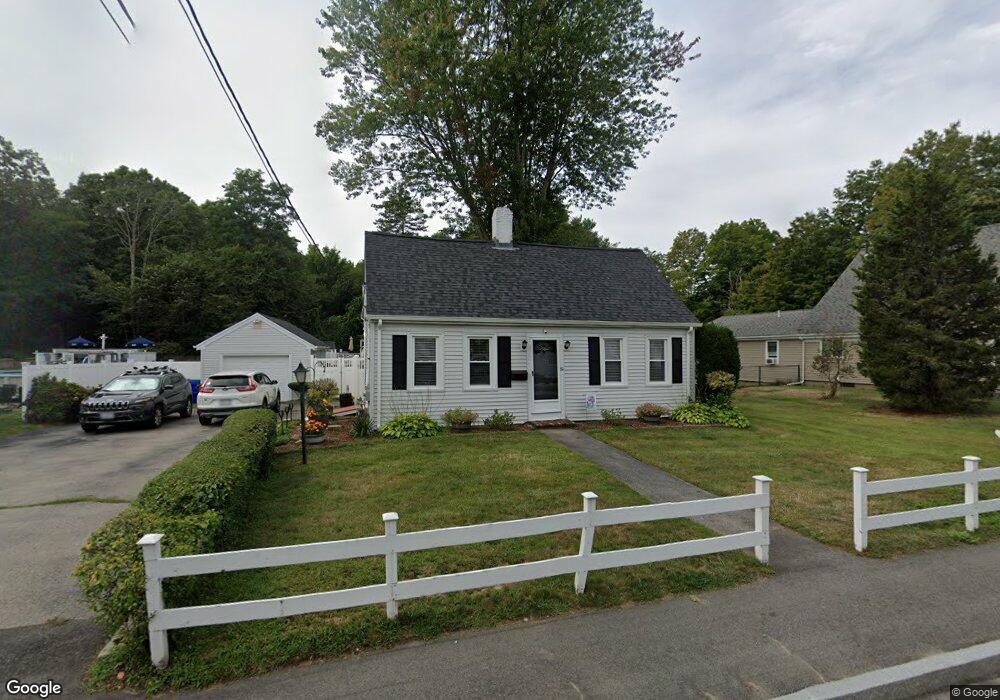
81 Spring St Rockland, MA 02370
Estimated Value: $540,136 - $602,000
3
Beds
1
Bath
1,500
Sq Ft
$377/Sq Ft
Est. Value
About This Home
This home is located at 81 Spring St, Rockland, MA 02370 and is currently estimated at $565,784, approximately $377 per square foot. 81 Spring St is a home located in Plymouth County with nearby schools including Rockland Senior High School, Calvary Chapel Academy, and St Bridget School.
Ownership History
Date
Name
Owned For
Owner Type
Purchase Details
Closed on
Feb 23, 2023
Sold by
Ruggiero Sheila
Bought by
Ruggiero Spr St Nomnee T
Current Estimated Value
Purchase Details
Closed on
May 29, 1996
Sold by
Couldstring Jo A
Bought by
Foster John F and Murray Shelia
Create a Home Valuation Report for This Property
The Home Valuation Report is an in-depth analysis detailing your home's value as well as a comparison with similar homes in the area
Home Values in the Area
Average Home Value in this Area
Purchase History
| Date | Buyer | Sale Price | Title Company |
|---|---|---|---|
| Ruggiero Spr St Nomnee T | -- | None Available | |
| Foster John F | $128,000 | -- | |
| Foster John F | $128,000 | -- |
Source: Public Records
Mortgage History
| Date | Status | Borrower | Loan Amount |
|---|---|---|---|
| Previous Owner | Foster John F | $125,001 | |
| Previous Owner | Foster John F | $25,000 | |
| Previous Owner | Foster John F | $109,000 |
Source: Public Records
Tax History
| Year | Tax Paid | Tax Assessment Tax Assessment Total Assessment is a certain percentage of the fair market value that is determined by local assessors to be the total taxable value of land and additions on the property. | Land | Improvement |
|---|---|---|---|---|
| 2025 | $6,184 | $452,400 | $236,500 | $215,900 |
| 2024 | $6,002 | $426,900 | $223,100 | $203,800 |
| 2023 | $6,103 | $401,000 | $215,100 | $185,900 |
| 2022 | $5,851 | $349,300 | $187,100 | $162,200 |
| 2021 | $5,502 | $318,400 | $170,000 | $148,400 |
| 2020 | $5,313 | $303,600 | $162,000 | $141,600 |
| 2019 | $5,191 | $289,700 | $154,300 | $135,400 |
| 2018 | $4,961 | $272,300 | $154,300 | $118,000 |
| 2017 | $4,845 | $262,200 | $154,300 | $107,900 |
| 2016 | $4,406 | $238,300 | $148,300 | $90,000 |
| 2015 | $4,230 | $222,300 | $138,700 | $83,600 |
| 2014 | $4,024 | $219,400 | $136,000 | $83,400 |
Source: Public Records
Map
Nearby Homes
- 215 Market St
- 5 Pat Rose Way
- 9 Pat Rose Way
- 8 Pat Rose Way
- 225 W Water St
- 340 Centre Ave Unit 44
- 103 Grove St Unit 349
- 103 Grove St Unit 317
- 135 Grove St Unit 115
- 135 Grove St Unit 110
- 135 Grove St Unit 133
- 119 Grove St Unit 238
- 119 Grove St Unit 223
- 810 Brookline Way
- 12 Linden St
- 50 Linden Park
- 7 Carlys Way
- 92 Liberty St
- 49 Liberty St
- 9 Old Market St
Your Personal Tour Guide
Ask me questions while you tour the home.